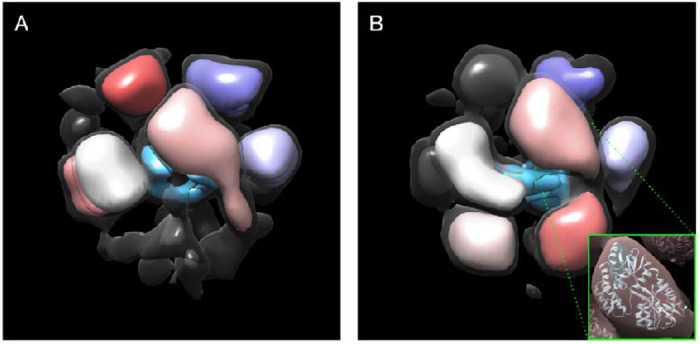
Figure 4.

Modeling the oligomeric state of MBP-FL Vpu. (A-B) Maps of the two oligomeric states with populations of 80% and 20% are shown in Figure 3 C and D, respectively. The regions where MPB could be docked are colored in pink, gray, shades of purple, and red. The electron density, which most likely represent Vpu oligomerization core is colored in blue. Views are from different angle than those in Figure 3. A lower isosurface threshold presented in transparent gray shows the lower-density connections in the reconstruction. The inset shows an MBP molecule (PDB: 1PEB) docked into the pink density region of the 3D model as a representative example.
