
Figure 6.
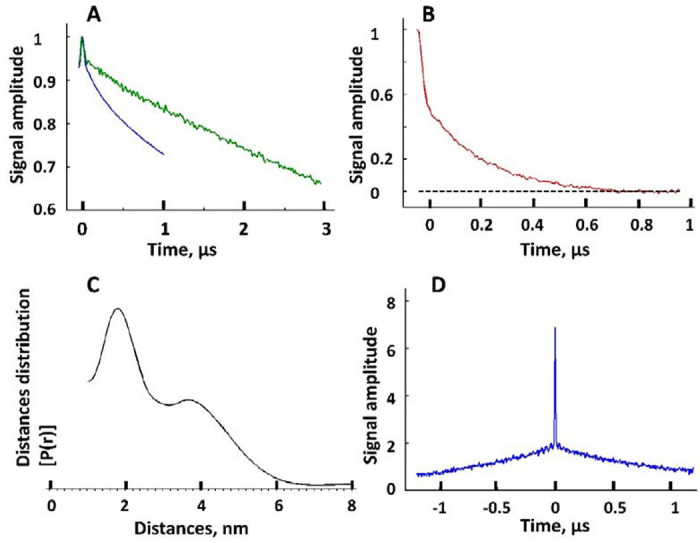
The DEER data and reconstructed inter-spin distances for Vpu spin-labeled at residue N55C. (A) Raw DEER data recorded for two different evolution times, 1 μs (blue) and 3 μs (green). (B) Background subtracted DEER signal for 1 μs evolution time data in A. The black dashed line indicates the zero-signal amplitude. (C) The reconstructed inter-spin distances for the data in B. (D) The intense narrow peak in DQC data originates from very short distances on the order of 10 Å for some spin-labels at N55C in Vpu oligomer. These distances are too short to be sensed by DEER whose sensitivity rolls off quickly below 20 Å.