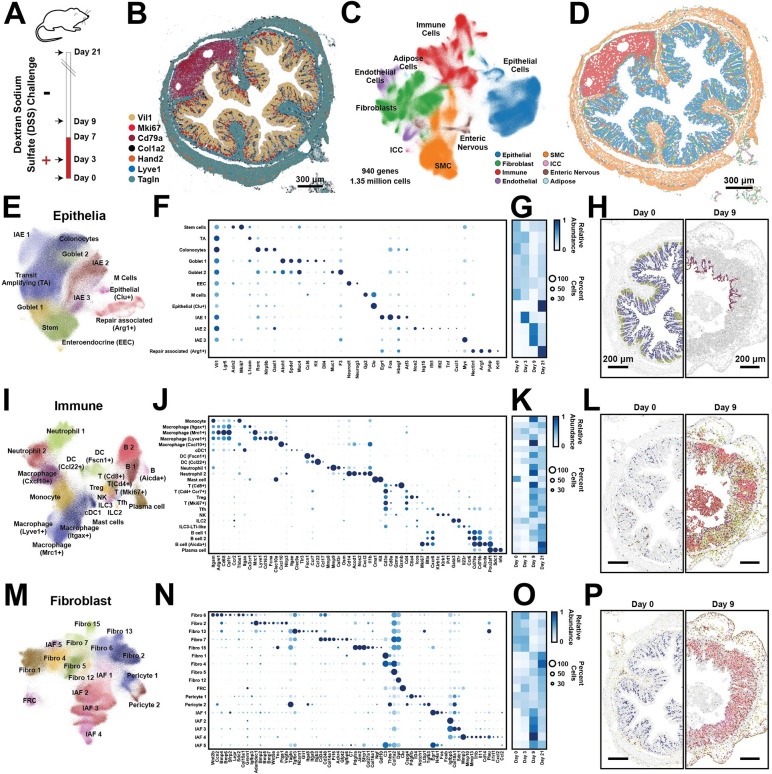
Figure 1: Cellular remodeling in a mouse colitis model.
(A) Time-course for the administration (red) or withdrawal (white) of dextran-sodium-sulfate (DSS) in the mouse colitis model. Arrows represent the time of tissue harvest.
(B) The spatial distribution of 7 of 940 RNAs measured with MERFISH in a single slice of the mouse distal colon harvested at Day 0. Dots represent individual RNA molecules and color indicates their identity. Scale bar: 300 μm.
(C) Uniform Manifold Approximation and Projection (UMAP) of 1.35 million cells measured via MERFISH for mice at all harvest days. Major cell classes are indicated via color. Smooth muscle cells (SMC). Interstitial cells of Cajal (ICC).
(D) The spatial distribution of major cell classes in the mouse colon slice shown in (B). Patches represent the cellular boundaries, and color indicates cell class as in (C). Scale bar: 300 μm.
(E) UMAP representation of all epithelial cells with individual epithelial populations colored and labeled.
(F) The expression of key genes in all identified epithelial populations. Color indicates the average expression of the listed gene and circle diameter represents the fraction of cells that express at least one copy of that RNA. Expression is normalized by the maximum value observed for each gene across all listed cell populations.
(G) The average abundance of each cell population per slice across the different harvest days, normalized to the maximum abundance.
(H) The spatial distribution of cells within representative portions of representative slices from Day 0 (left) and Day 9 (right). The centroid of individual cells is plotted with epithelial cells colored by their identity as in (E) and all other cells in gray. Scale bars: 200 μm
(I)-(L) As in (E)-(H) but for all immune populations.
(M)-(P) As in (E)-(H) but for all fibroblast populations.

