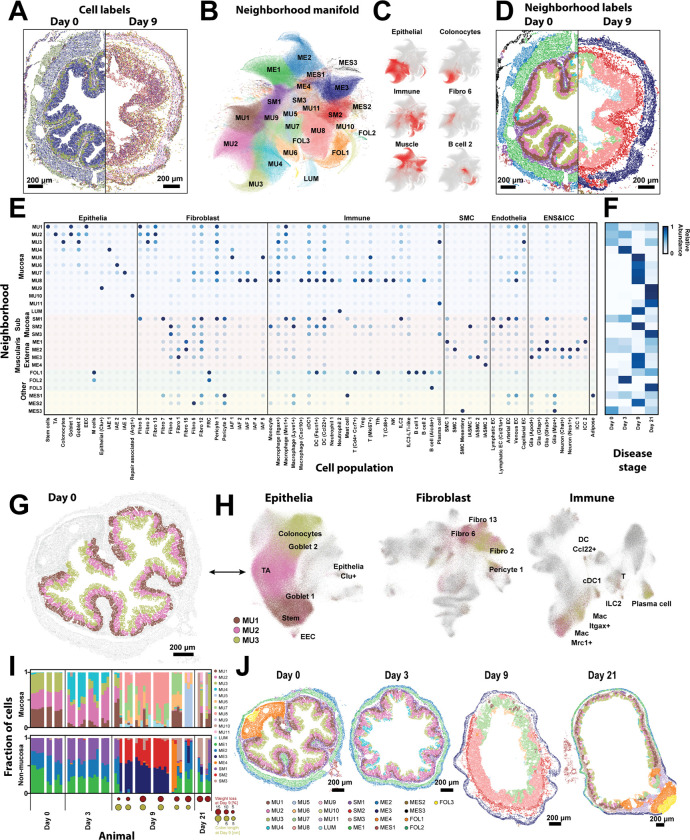
Figure 2: Cellular neighborhoods define the spatial remodeling of the colon during DSS-treatment.
(A) The spatial distribution of all cell types in representative slices from Day 0 and Day 9. Dots represent cell centroid, and color indicates cell identity. Scale bars: 200 μm.
(B) UMAP representation of the cellular neighborhoods that arise in all slices across all disease stages. Markers represent individual cells colored by the statistically distinct neighborhoods to which they were assigned. MU: mucosal; LUM: luminal; SM: submucosal; ME: muscularis externa; FOL: follicle; MES: mesentery.
(C) UMAP representation of cellular neighborhoods in which each cell is colored by the fraction of its neighbors that are the listed cell class (left) or cell cluster (right).
(D) The spatial distributions of cell types in the same slices in (A) colored by the tissue neighborhood to which they were assigned as in (B).
(E) The fraction of each cell population found within each cellular neighborhood, normalized to the maximum value.
(F) The average fraction of cells per slice assigned to each neighborhood for each disease stage, normalized by the maximum fraction observed at any day.
(G) The spatial distribution of cells within a representative slice taken from Day 0 with all cells colored gray and cells assigned to each of the healthy mucosal neighborhoods, MU1, MU2, and MU3, colored as designated.
(H) UMAP representation of all epithelial, immune, and fibroblast cells. Cells are colored by the neighborhood to which they have been assigned using the same colors as in (G) with all other cells not in MU1, MU2, and MU3 colored gray.
(I) The fraction of cells in mucosal (top) or non-mucosal (bottom) neighborhoods measured within individual slices, grouped by the mouse of origin and the disease stage. Circles at Day 9 and Day 21 represent Day 9 measurements of the weight loss relative to Day 0 (red) or the colon length (yellow).
(J) The spatial organization of all neighborhoods in representative slices taken from mice at each disease stage. Markers represent cell centroids and are colored based on neighborhood assignment. Scale bars: 200 μm.

