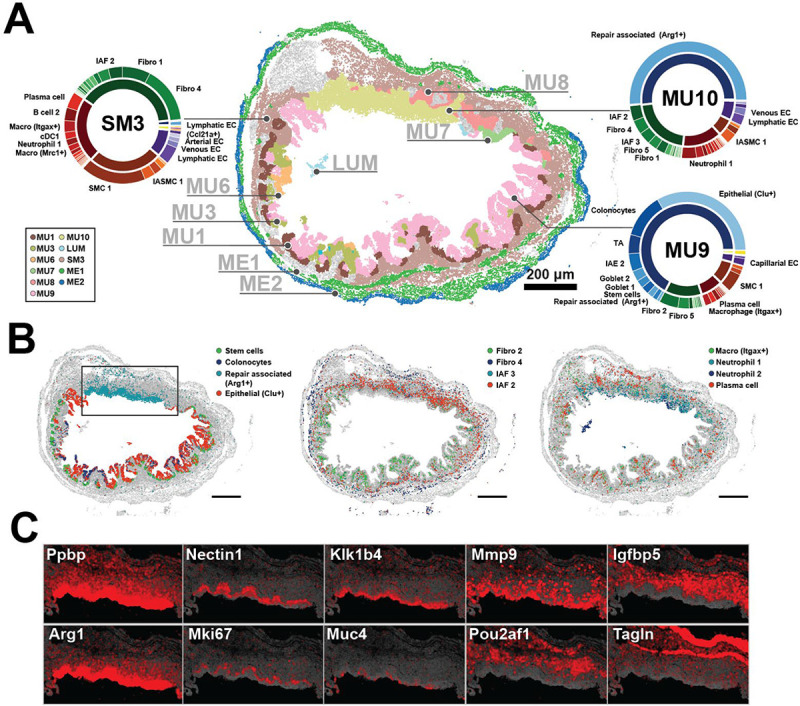
Figure 4: Cellular neighborhoods define the organization of repairing tissue.

(A) The spatial distribution of mucosal neighborhoods in a representative repairing slice (Day 21). Markers represent the cell centroids and color indicates neighborhood assignment. Pie charts represent neighborhood composition of cell classes (inner) or cell clusters (outer). Prominent populations are labeled. Scale bar: 200 μm.
(B) The spatial distribution of cell populations that define neighborhoods observed at Day 21. Scale bars: 200 μm.
(C) The spatial distribution of RNAs that highlight the structure of the MU10 repairing ulcer plotted for the black boxed region in (B). The centroids of all RNAs are plotted in gray and the listed RNAs in red.
