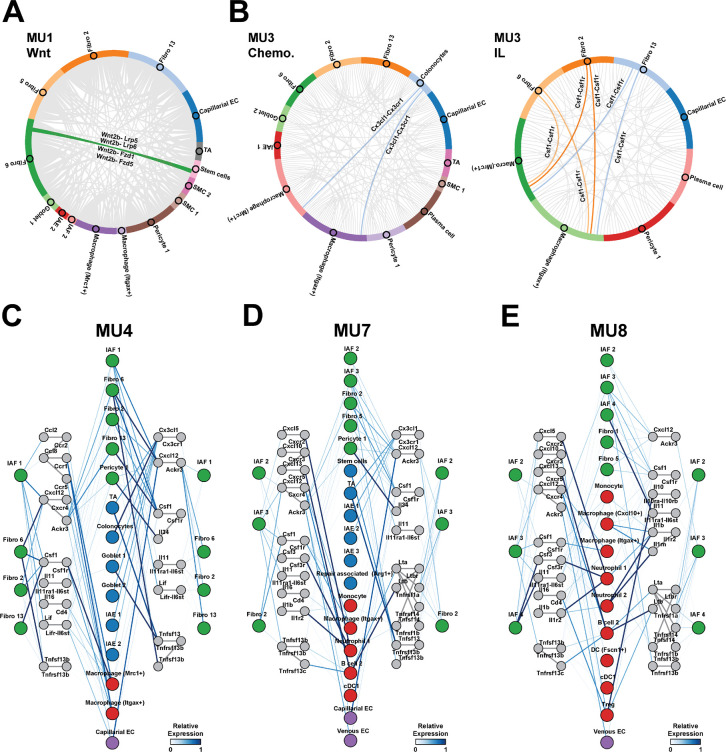
Figure 5: Spatially prioritized receptor-ligand interactions suggest unique roles for IAFs in different cellular neighborhoods.
(A) Circos plots showing the interaction frequency between cell populations in MU1 for all Wnt-family ligand-receptor interactions. Highlighted connections represent key known fibroblast-epithelial interactions.
(B) As in (A) but for chemokines (left) and interleukins (right) for all cell populations in MU3. Highlighted connections represent key known fibroblast-immune interactions.
(C-E) Putative interaction map describing signals to and from fibroblasts in inflammation-associated neighborhoods, MU4 (C), MU7 (D), and MU8 (E). Colored circles represent major cell populations in these neighborhoods with color indicating cell class (fibroblast: green, epithelial: blue, immune: red, EC: purple). Gray colored circles represent ligands or receptor complexes and lines connecting these circles represent documented interacting pairs. Lines connecting cell populations to ligands or receptors represent expression in those populations and colored by the average expression within that population normalized to the maximum observed in any population in any neighborhood.

