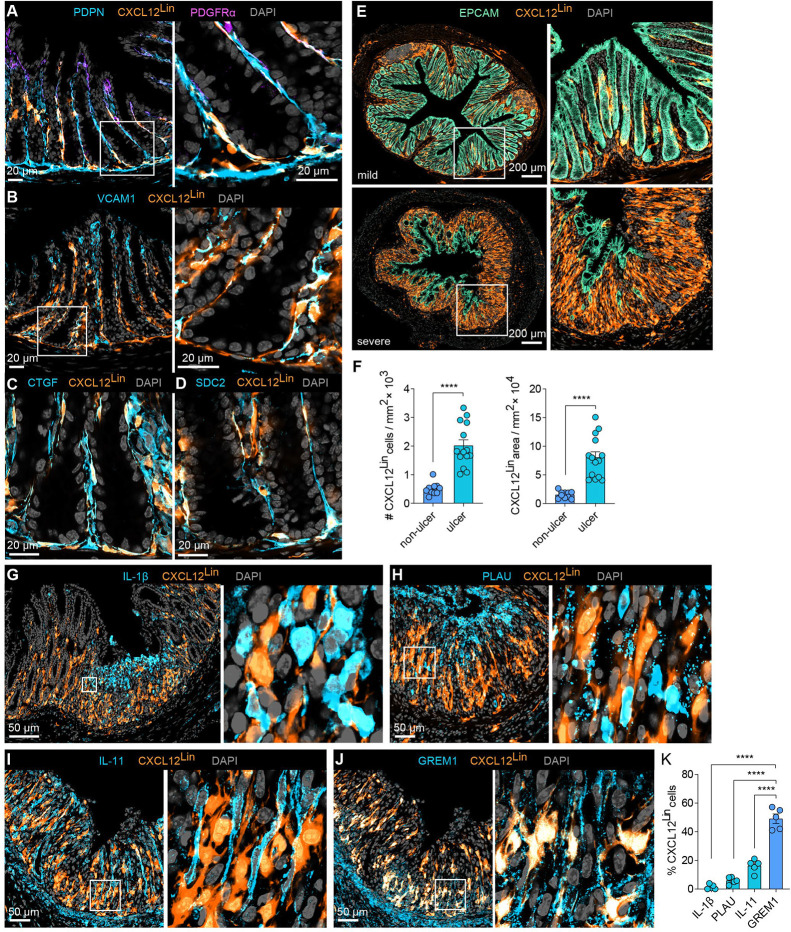
Figure 6. Lineage tracing reveals distinct origins of IAF populations.
(A) Representative immunofluorescence images of colon cross sections from Day 0 mice (n=5) highlighting the overlap of CXCL12Lin cells with the pan-fibroblast marker PDPN and low overlap with top-crypt PDGFRαhi cells. A zoom-in on boxed region is highlighted (right). Scale bar: 20 μm.
(B-D) As in (A) but for markers of Fibro 6: VCAM1 (B), CTGF (C), and SDC2 (D). Scale bars: 20 μm.
(E) Representative immunofluorescence images of colon cross sections from Day 9 mice sorted by mild or severe weight loss. Right panels show magnification of boxed areas (n=5–6). Scale bar: 200 μm.
(F) CXCL12Lin cell number and area in tissue sections collected at Day 9 in ulcerated or non-ulcerated tissue regions (n=6–7). The bar represents the mean, the error bars represent standard error of the mean (SEM), and markers are individual mice. ****p<0.0001.
(G-J) Representative immunofluorescence images of ulcerated regions, harvested on Day 9 showing overlap of CXCL12Lin with IL-1β, PLAU, IL-11, or GREM1.
(K) The fraction of cells positive for CXCL12Lin that overlap with IL-11, GREM1, IL-1β and PLAU in ulcerated tissue regions as shown in (G-J). The bar represents mean, the error bars represent SEM, and markers are individual mice. ****p<0.0001.

