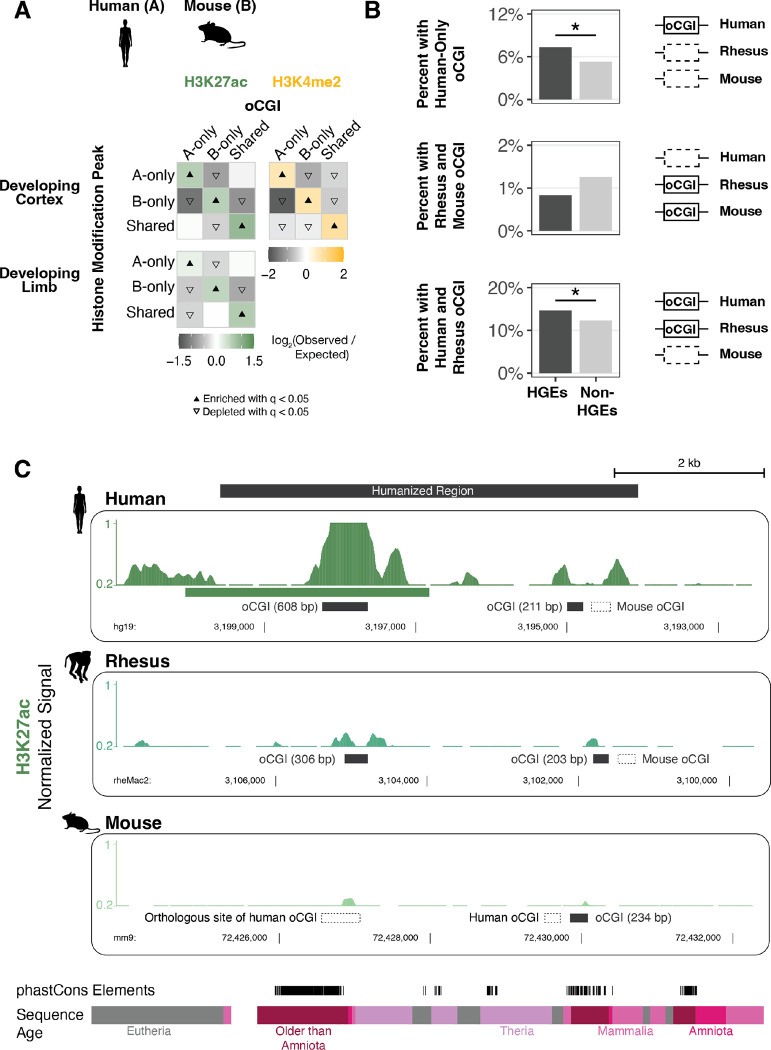
Figure 4. Association of species-specific oCGIs with species-specific histone modification peaks and HGEs in the developing human cortex and limb.
(A) Enrichment and depletion in each indicated comparison of species-specific and shared oCGIs (top: A-only, B-only, Shared) and species-specific and shared peaks (left: A-only, B-only, Shared), compared to a null expectation of no association between oCGI turnover and peak turnover. As in Figure 3C–D, each 3 × 3 grid shows the results for a specific test examining oCGIs and their overlap with two histone modifications: H3K27ac (left), and H3K4me2 (right). Each box in each grid is colored according to the level of enrichment over expectation (green for H3K27ac or yellow for H3K4me2) or depletion (gray for all marks) of genome-wide sites that meet the criteria for that box. The color bar below each plot illustrates the level of enrichment or depletion over expectation. The filled upward-pointing triangles denote significant enrichment and open downward-pointing triangles denote significant depletion (q < 0.05, permutation test, BH-corrected; see Fig. S17 and Methods). One representative comparison is shown for developing cortex (8.5 post-conception weeks (p.c.w.) in human versus embryonic day 14.5 in mouse) and developing limb (embryonic day 41 in human versus embryonic day 12.5 in mouse). (B) Enrichment of specific oCGI species patterns in HGEs compared to non-HGE enhancers in human cortex at 8.5 p.c.w. Bar plots show the percentage of HGEs (left) or non-HGE enhancers (right) that overlap an oCGI with the specified species pattern: oCGI in human only, oCGI in rhesus & mouse but absent in human, and oCGI in human & rhesus but absent in mouse. Significance was determined using a resampling test comparing HGEs to non-HGE human enhancers matched for overall histone modification levels (resampling test, BH-corrected; see Fig. S28 and Methods). (C) One representative HGE, hs754. H3K27ac levels are shown in developing cortex at human 8.5 p.c.w., rhesus embryonic day 55, and mouse embryonic day 14.5. H3K27ac signal tracks show the number of sequenced fragments per million overlapping each base pair. Black bars denote the locations of oCGIs in each species, and empty bars with dotted lines denote the locations where an orthologous sequence in another species contains an oCGI. Additional tracks show the locations of phastCons elements and sequences of the indicated evolutionary origin. For the purposes of visualization, features in rhesus and mouse have been aligned to the location of an orthologous base pair within the human peak due to overall differences in orthologous sequence lengths.

