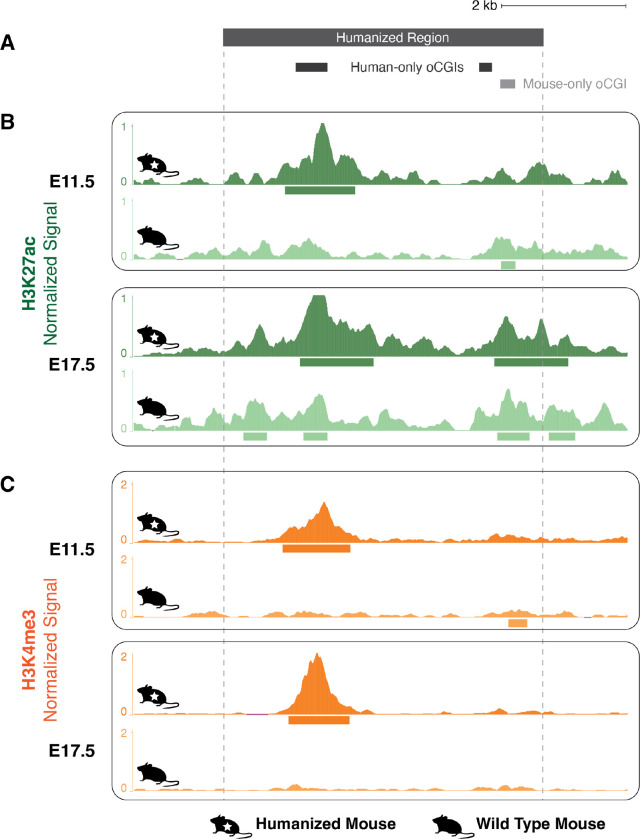
Figure 5. Gain of H3K27ac and H3K4me3 associated with a human oCGI in a humanized mouse model.
(A) Locations of oCGIs within hs754 and its mouse ortholog. Dark gray boxes indicate the locations of two human oCGIs not present in the mouse sequence, and the light gray box indicates the location of a mouse oCGI not present in the human sequence. (B) H3K27ac levels in developing diencephalon at the humanized hs754 (top) or wild type (bottom) mouse locus at E11.5 and E17.5. Dark green (humanized) and light green (wild type) tracks show normalized H3K27ac levels as counts per million reads calculated in adjacent 10-bp bins. Peak calls are shown as boxes below the signal tracks. Nominal p-values were obtained by DESeq2 using a Wald test, then BH-corrected for multiple testing across all peaks genome-wide to generate q-values (see values in main text and in Fig. S31). (C) H3K4me3 levels in developing diencephalon at the humanized hs754 (top) or wild type (bottom) mouse locus at E11.5 and E17.5. Data are shown as in (B) but with H3K4me3 signal in dark orange (humanized) or light orange (wild type). The humanized hs754 locus is larger than the wild type locus, so for the purposes of visualization all humanized tracks have been shifted 190 bp to the left, bringing orthologous regions within the oCGI into alignment.

