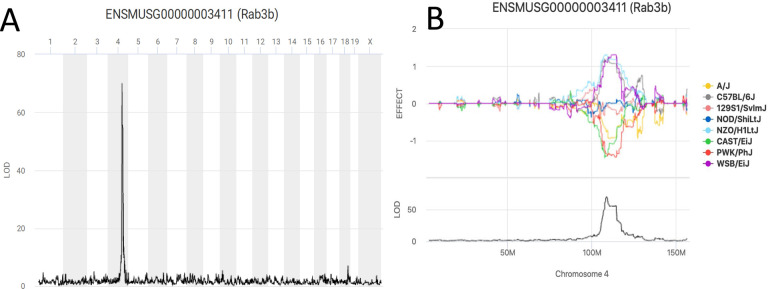
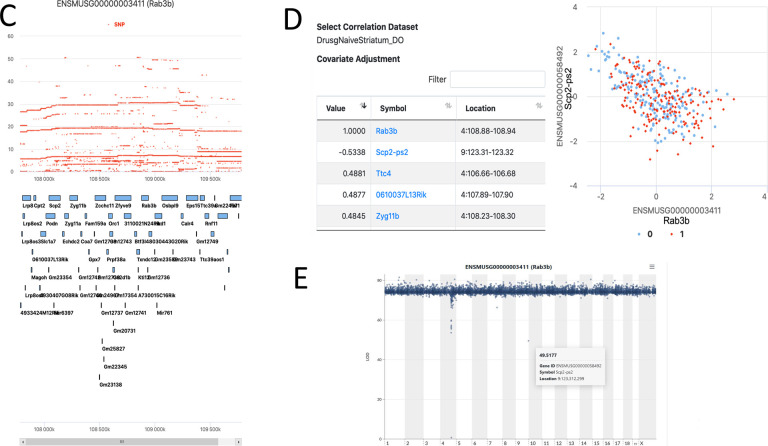
Figure 2. The Rab3b cis-eQTL data retrieved in QTL Viewer.
A. A genome scan for Rab3b expression in the Diversity Outbred (J:DO) mice striatum identifies a strong (LOD > 65) cis-eQTL on chromosome 4. B. The allele effect plot for the haplotypes of the J:DO that regulate the expression of Rab3b. There are strong effects of WSB/EiJ, NZO/HILtJ, and C57BL/6J on the expression in one direction and 129S1/SvJ, CAST/EiJ, and A/J in the opposite direction. C. SNP association mapping within the QTL peak interval displaying all the SNPs that drive the QTL. Most of the highest score SNPs are around Rab3b, as expected for a gene regulated in cis. D. The genes that are negatively (Scp2-ps2) or positively (Ttc4, 0610037L13Rik, Zyg11b) correlated with Rab3b expression can be displayed. A scatter plot can be generated for each gene with the gene of interest. E. Mediation analysis can be performed on the data set to identify candidate causal mediators. This analysis retests the QTL effect at the locus of interest, iteratively conditioned on candidate mediators. Here the SNP in Scp2-ps2 creates the greatest LOD drop.


