Figure 4.
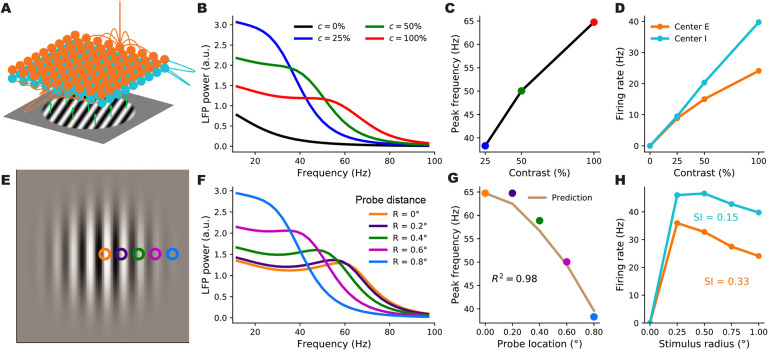
A retinotopically-structured SSN model of V1, with a boost to local, intra-columnar excitatory connectivity, exhibits a local contrast-dependence of gamma peak frequency, as well as robust surround suppression of firing rates. A: Schematic of the model’s retinotopic grid, horizontal connectivity, and stimulus inputs. Each cortical column has an excitatory and an inhibitory sub-population (orange and cyan balls) which receive feedforward inputs (green arrows) from the visual stimulus, here a grating, according to the column’s retinotopic location. Orange lines show horizontal connections projecting from two E units; note boost to local connectivity represented by larger central connection. Inhibitory connections (cyan lines) only targeted the same column, to a very good approximation. B: LFP power-spectra in the center column evoked by flat gratings of contrasts 25% (blue), 50% (green), and 100% (red). C: Gamma peak frequency as a function of flat grating contrast. Note that peaks were defined as local maxima of the relative power-spectrum, i.e., the point-wise ratio of the absolute power-spectrum (as shown in B), to the power-spectrum at zero contrast; see Methods. D: Firing rate responses of E (orange) and I (cyan) center sub-populations as a function of grating contrast. E: The Gabor stimulus with non-uniform contrast (falling off from center according to a Gaussian). The colored circles show the five different cortical locations (retinotopically mapped to the visual field) probed by the LFP “electrodes”. The orange probe was at the center and the distance between adjacent probe locations was 0.2° of visual angle (corresponding to 0.4 mm in V1, the width of the model columns). F: LFP power-spectra evoked by the Gabor stimulus at different probe locations (legend shows the probe distances from the Gabor center). G: Gamma peak frequency of the power-spectra at increasing distance from the Gabor center. The golden curve is the prediction for peak frequency in the displaced probe location based on the Gabor contrast in that location and the gamma peak frequency obtained in the center location for the flat grating of the same contrast. The predictor’s fit to actual Gabor frequencies is very tight (R2=0.98), exhibiting local gamma contrast dependence. H : Size tuning curves of the center E (orange) and I (cyan) subpopulations, at full contrast. E and I firing rates vary non-monotonically with grating size and exhibit surround suppression (suppression indices were 0.33 and 0.15, respectively.

