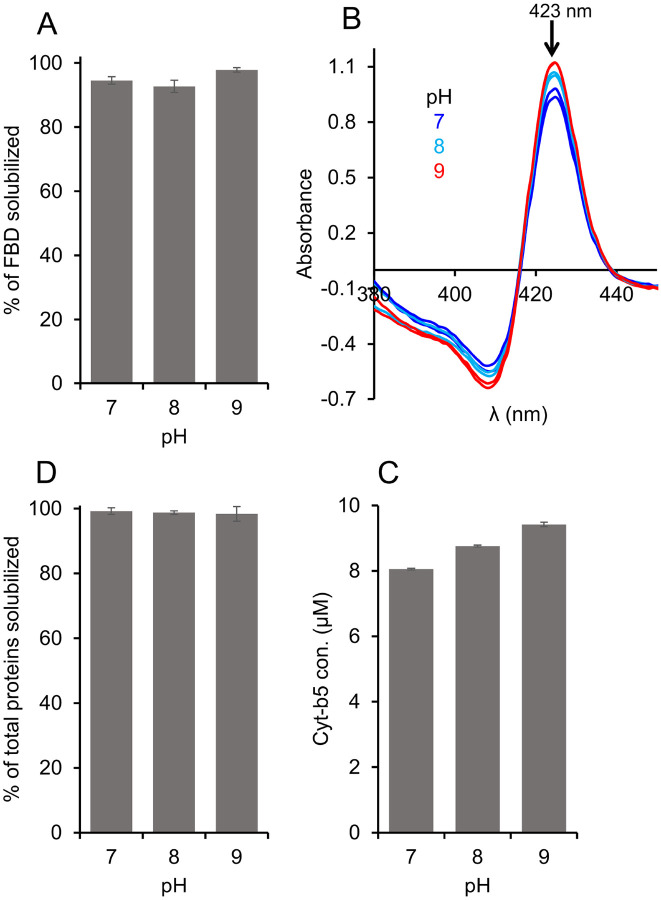
Figure 4.
Effect of pH on the pentyl-inulin-based solubilization of E. coli membranes enriched with (A) FBD, (B, C) Cyt-b5, and (D) total E. coli membrane proteins. Cyt-b5 concentration was measured using absorbance spectra recorded at different pH conditions as indicated (B). The bargraphs indicate the % of proteins in the polymer-solubilized samples estimated from protein band intensities in SDS-PAGE gels using ImageJ software. Error bars indicate the difference in the extent of solubilization between two independent experiments; data points are given as average values.

