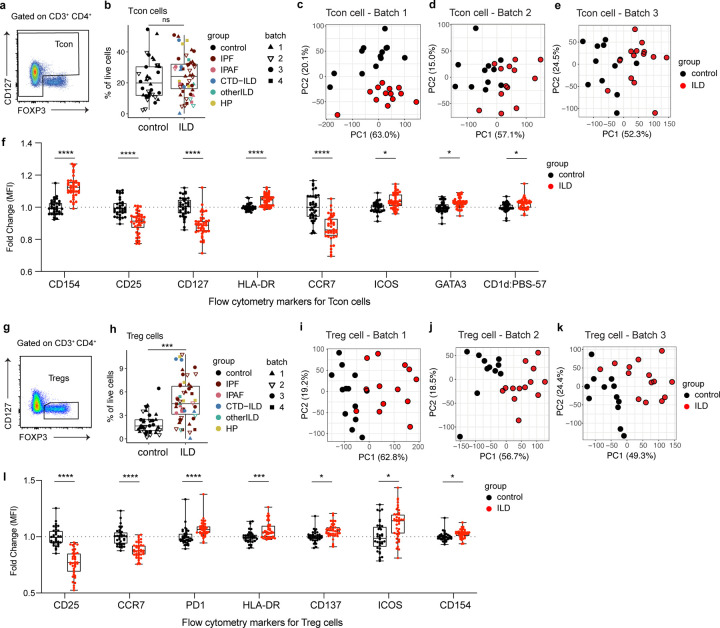
Figure 2. ILD patients have elevated Tregs with unique phenotypes compared to controls.
a. Representative flow cytometry gating for Tcon cells in LLNs. Cells were pre-gated on live, CD3+, CD4+ cells. b. Frequencies of Tcon cells in live cells in control vs ILD LLNs. Statistical significance was tested by the Wilcoxon rank sum test. c-e. PCA of Tcon cells based on fluorescence intensities of 16 parameters: CD154, CD25, CD127, HLA-DR, CCR7, ICOS, GATA3, PBS-57 loaded CD1d tetramer, Vα7.2, RORγt, BCL6, PD1, CD137, CD38, CD45RA, and Vδ. An analysis was run with 10,000 cells, 2,300 cells, and 10,000 cells for batch1, batch2, and batch 3, respectively. f. Box plots comparing the median fluorescence intensity of individual Tcon markers between ILD and controls, based on all samples in batches 1–3. Fold change was calculated relative to the mean values of control samples, separately for each batch. Parameters that are significantly associated with ILD based on a likelihood-ratio test on each logistic regression coefficient are shown. Non-significant parameters are shown in Extended Figure 2. P-values were adjusted by Benjamini-Hochberg correction. G. Representative flow cytometry gating for Treg cells in LLNs. Cells were pre-gated on live, CD3+, CD4+ cells. H. Frequencies of Treg cells in live cells in control vs ILD LLNs. Statistical significance was tested by the Wilcoxon rank sum test. I-k. PCA of Treg cells based on fluorescence intensities of 12 parameters: CD25, CD154, HLA-DR, CCR7, ICOS, GATA3, RORγt, BCL6, PD1, CD137, CD38, CD45RA. An analysis was run with 1,000 cells, 269 cells, and 1,300 cells for batch1, batch2, and batch 3, respectively. L. Box plots comparing the median fluorescence intensity of individual Treg markers between ILD and controls, based on all samples in batches 1–3. Calculations of fold changes and adjusted p-values were done as described above (f). P<0.05 (*), P<0.01 (**), P<0.001 (***), P<0.0001 (****).

