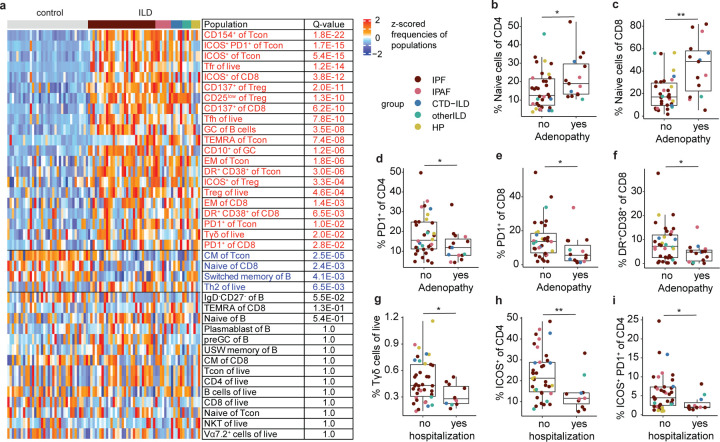
Figure 3. Cells in LLNs of ILD patients have significant adaptive immune activation signatures, some of which are associated with patients’ clinical history.
a. Heatmap visualizing batch-normalized z-scores of populational frequencies ranked in the order of statistical significance in difference between ILD and control LLNs. A total of 39 populations were quantified by flow cytometry using gating strategies shown in Extended Figures 3 and 4. An associated with ILD was tested for each cell population by a likelihood-ratio test on each linear regression coefficient. Q-values are adjusted p-values based on the Benjamini-Hochberg method. b-f. Quantifications of immune cell populations that are significantly different between ILD patients who had lymphadenopathy (yes) and ILD patients who did not have lymphadenopathy (no) based on chest CT scans obtained at diagnosis. g-i. Quantifications of immune cell populations that are significantly different between ILD patients who had history of hospitalization due to respiratory cause (yes) and ILD patients who had not been hospitalized prior to transplantation (no).

