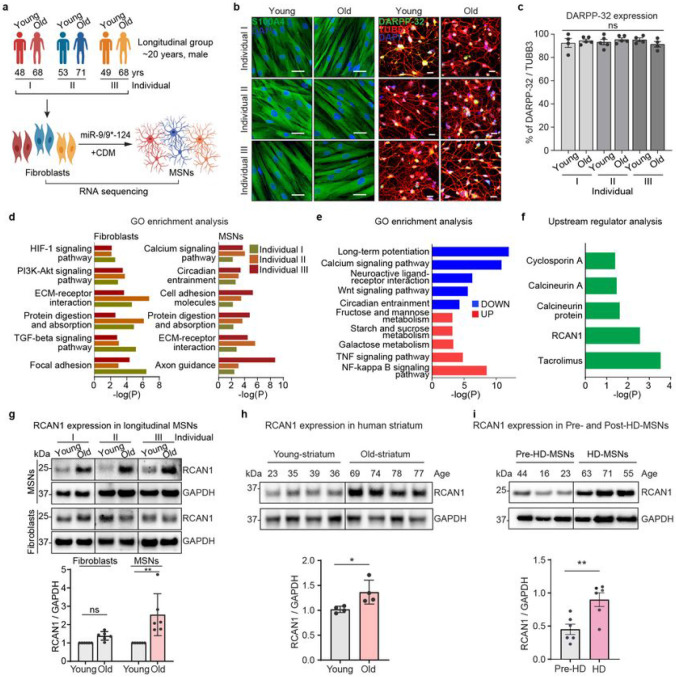
Fig. 1 ∣. Identification of RCAN1 as an age-associated factor in reprogrammed MSNs from longitudinally collected fibroblasts.
a, Experimental scheme of RNA-sequencing in fibroblasts and reprogrammed MSNs (young and old) from three independent longitudinal groups (individual I, II, III). MSNs were reprogrammed by overexpressing miR-9/9* and miR-124 (miR-9/9*-124) as well as MSN-defining transcription factors, CTIP2, DLX1, DLX2, and MYT1L (CDM). b, Representative images of fibroblasts of young and old longitudinal groups marked by S100A4 (left) and reprogrammed MSNs marked by DARPP-32 from three individuals. c, Quantification of DARPP-32 positive cells from reprogrammed MSNs from all samples (n=4~5 replicates per sample from 6 individuals). An average of 300 cells were counted from four or more randomly chosen fields. Scale bars represent 20 μm. d, Gene Ontology (GO) enrichment analysis of all DEGs in two replicates of old-fibroblasts (left) and old-MSNs (right) from three independent individuals (FDR<0.05, ∣FC∣≥1.5). e, GO enrichment analysis of up-/down-regulated genes commonly manifested in old-MSNs compared to young-MSNs (FDR<0.05, ∣FC∣≥1.5). f, Upstream regulator analysis of up-/down-regulated genes in old-MSNs in (e). g, Representative Immunoblotting (top) and quantification (bottom) of RCAN1 in six longitudinal MSNs and six fibroblasts (young and old) from three independent individuals (n=6 replicates). The quantification is normalized to values from young samples per line. h. Representative immunoblotting (top) and quantification (bottom) of RCAN1 expression in eight human striatum samples aged 23, 35, 39, 36 (young) and 69, 74, 78, 77 (old) years old (n=8 individuals). i, Representative immunoblotting (top) and quantification (bottom) of RCAN1 expression in three reprogrammed MSNs from presymptomatic patients aged 44, 16, 23 years old (pre-HD-MSN: Pre-HD.42, Pre-HD.45, Pre-HD.40/50) and three reprogrammed MSNs from symptomatic patients aged 63, 71, 55 years old (HD-MSN: HD.47, HD.40, HD.45) (n=6 replicates). Statistical significance was determined using one-way ANOVA (c) and unpaired t-test (g,h,i); **p<0.01, *p<0.05, ns, not significant and mean±s.e.m. The sample size (n) corresponds to the number of biological replicates.

