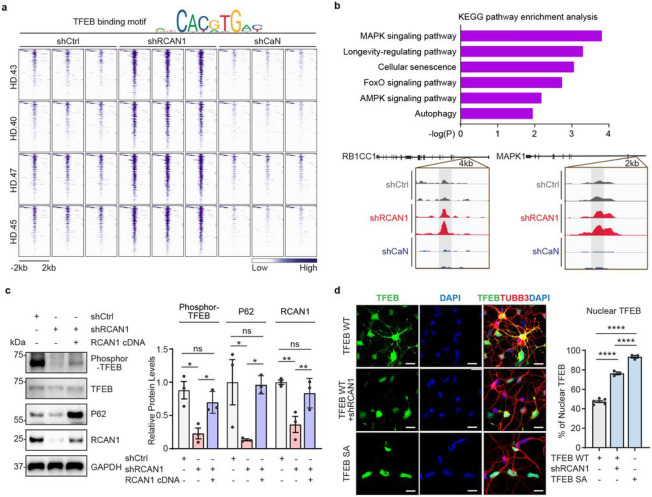
Fig. 4 ∣. Enhancing TFEB function by RCAN1 KD via its nuclear localization.
a, Heatmap representation of open DARs with shRCAN1 (rescuing) and closed DARs with shCaN (detrimental) harboring TFEB binding motifs, compared to shCtrl Motif analysis from ATAC-sequencing was from four independent HD-MSNs (HD.43, HD.40, HD.47, HD.45, three replicates each) (FDR<0.05, FC≥−1.5). Top legend depicts representative motifs for TFEB binding sites. b, KEGG pathway enrichment analysis (top) of TFEB-binding motif containing genes associated with DARs in (a). Integrative Genomics Viewer (IGV) snapshots (bottom) showing peaks enriched in shRCAN1-HD-MSNs (red) and reduced in shCaN-HD-MSNs (blue) within RB1CC1 and MAPK1 in comparison to shCtrl (grey). c, Representative Immunoblotting (left) and quantification (right) of the expression of phosphor-TFEB (Ser142) from three independent HD-MSNs (HD.43, HD.40, HD.47, n=3) transduced with shCtrl, shRCAN1, or RCAN1. d, Representative image (left) and quantification (right) of nuclear TFEB from three-independent HD-MSNs (HD.43, HD.40, HD.47, n=3~6) transduced with TFEB wildtype (WT), shRCAN1, or TFEB phosphor-mutant (S142/211A, SA). Cells were immunostained with anti-TFEB and TUBB3 antibodies. An average of 130 cells per each were counted from three or more randomly chosen fields. Scale bars represent 20 μm. Statistical significance was determined using one-way ANOVA in (c,d); ****p<0.0001, **p<0.01, *p<0.05, ns: not significant, and mean±s.e.m. Each dot represents one individual’s reprogrammed HD-MSNs (c,d). The sample size (n) corresponds to the number of biological replicates (c,d).

