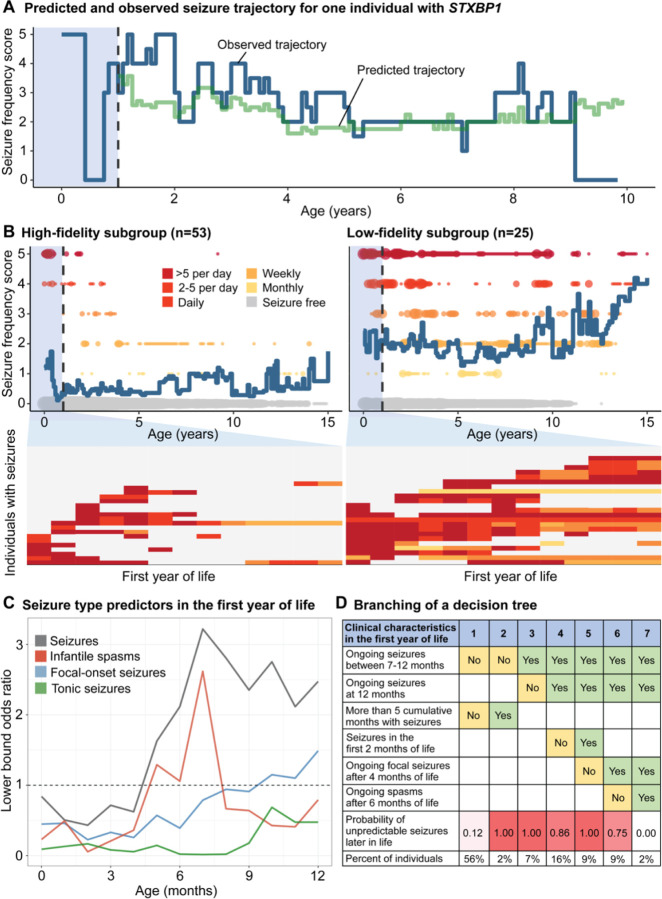
Figure 4. Longitudinal modeling of seizure histories in the first year of life in STXBP1 revealed two subgroups with unpredictable and predictable epilepsy trajectories later in life.
(A) Observed and predicted monthly seizure trajectory for one individual. The seizure history during the first 12 months were used to define a reference cohort of most phenotypically similar individuals. Seizure frequencies in the reference subgroup were then used to predict the individual’s trajectory. The difference in observed and predicted seizure frequencies across months was used to characterize the variability. (B) Variability was assessed across the cohort (n=78), with two subgroups: high-fidelity subgroup defined by predictable trajectories versus low-fidelity subgroup defined by unpredictable trajectories, showing seizure frequencies in the first year of life that resulted in high or low-fidelity predictions of longitudinal epilepsy trajectories later in life. (C) Seizure types leading to risk of having unpredictable seizures later in life. (D) Single decision tree, showing the branching of subgroups based on epilepsy characteristics or predictors for unpredictable seizure trajectories.

