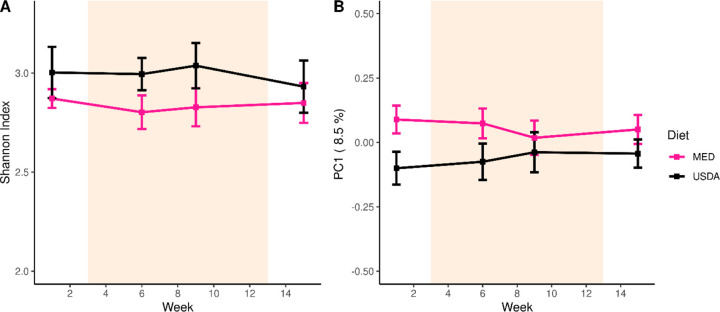
Figure 5: Fecal Microbiome Composition.
(A) A line plot displaying the microbial diversity, as measured by the Shannon Index, of individuals over time. (B) A line plot displaying the microbial composition of individuals over time. The y-axis is the first principal coordinate produced by Bray-Curtis dissimilarity ordination of the microbiome. In both (A) and (B), the orange shaded area depicts the active intervention period and the standard error is represented by error bars.

