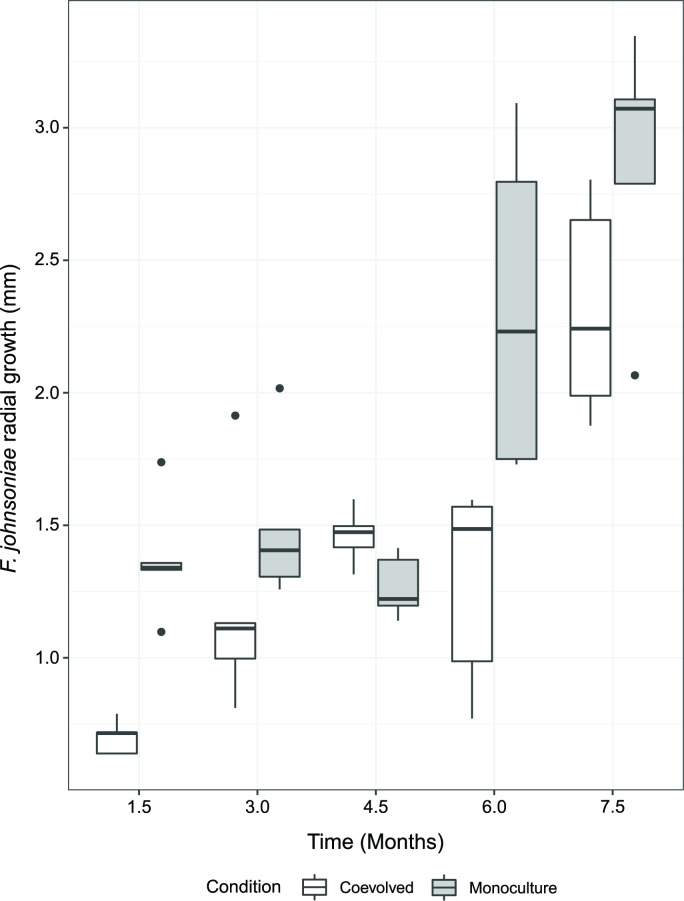
Fig. 4.
F. johnsoniae trends toward increased growth success with each plate passage in the presence of B. thailandensis . Images were taken at the end of each plate passage (1.5 mos) to quantify radial growth for both F. johnsoniae monoculture evolved (gray bars) lines and F. johnsoniae coevolved (white bars) lines (n=5 independent replicated per time point). Radial colony growth was measured from the center of the colony to the point of furthest growth on the agar plate. The bottom and top of each box are the first and third quartiles, respectively, and the line inside the box is the median. The whiskers extend from their respective hinges to the largest value (top), and smallest value (bottom) no further away than 1.5× the interquartile range. Black points on a boxplot represent outliers that were greater than 1.5 times the interquartile range.

