Figure 4.
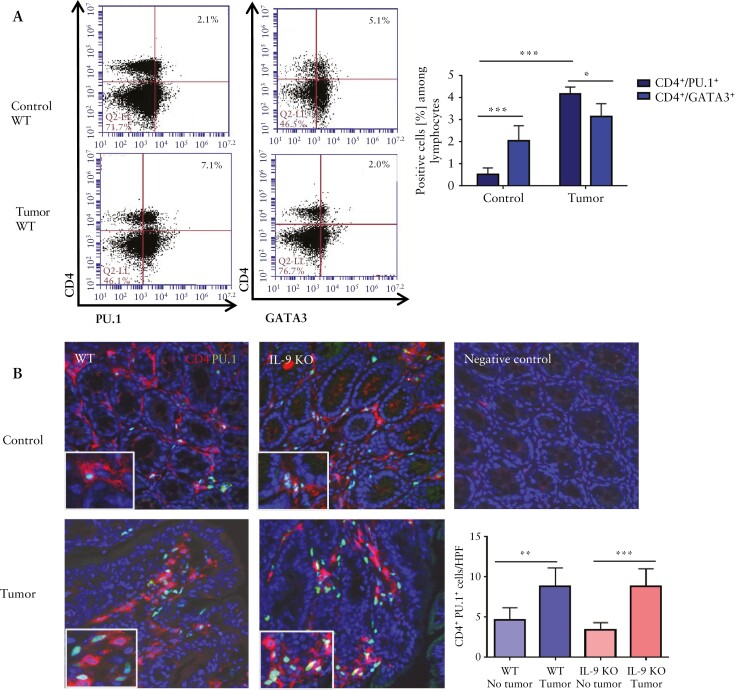
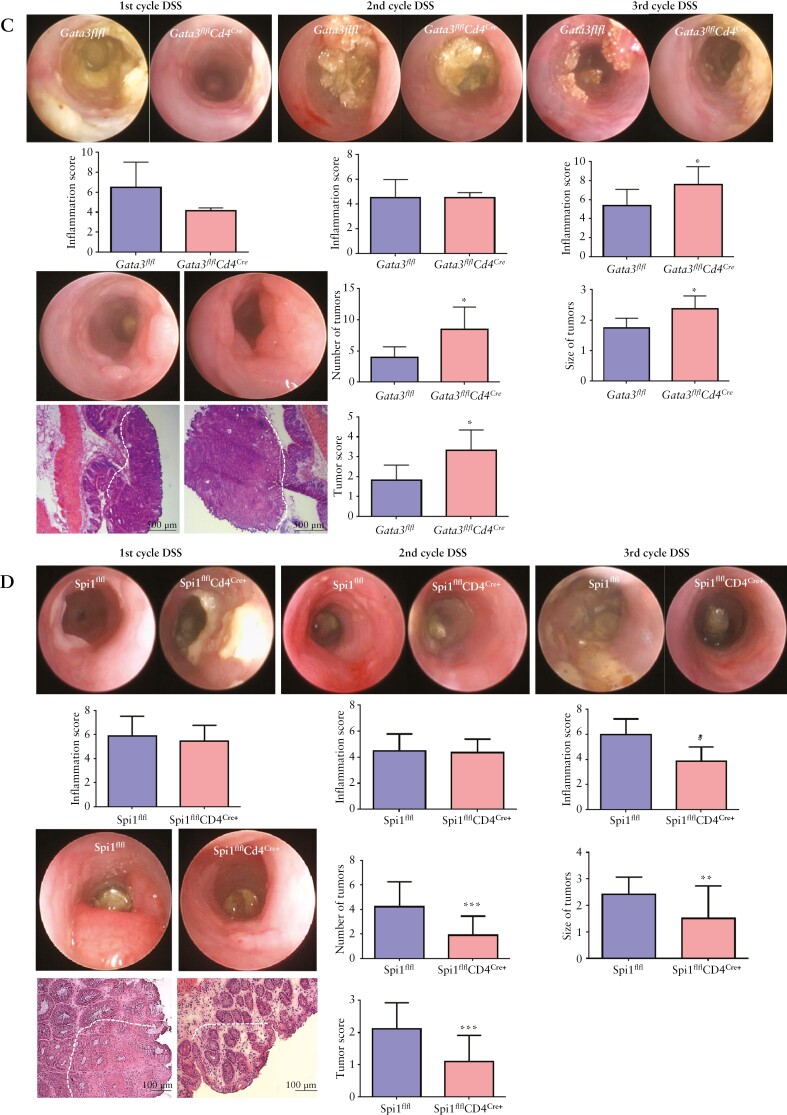
Function of GATA3+ T cells and PU.1+ T cells in experimental CRC. A] CD4+ LPMCs from tumour and control tissue of AOM/DSS-treated wild-type mice were analysed by FACS for the expression of GATA3 and PU.1. Representative scatter plots are shown. Significant differences are indicated [*p <0.05; ***p <0.001]. Results combine values from four mice per group. Gating strategy is shown in Supplementary Figure 1. B] Cryosections of colitis-associated colonic tumours from wild-type and IL-9 KO mice stained with an anti-PU.1 antibody [green], an anti-CD4 antibody [red], and DAPI. Statistical analysis of three mice per group is shown [**p <0.01; ***p <0.001]. C] Conditional GATA3 KO mice were analysed in the AOM/DSS model. Analysis of inflammation after each DSS cycle, tumour number, tumour size and tumour score were determined. Shown are representative pictures of seven mice per group and significant differences [*p <0.05]. The tumour margin is highlighted by a dashed line. D] Miniendoscopic analysis of mice with conditional inactivation of PU.1 in T cells treated with AOM/DSS. Inflammation scoring, tumour growth and number analysis were performed. Data represent results of three independent experiments with five mice per group. Significant differences are indicated [*p <0.05; **p <0.01; ***p <0.001]. The tumour margin is highlighted by a dashed line. CRC, colorectal cancer; AOM, azoxymethane; DSS, dextran sodium sulphate; LPMCs, lamina propria mononuclear cells.


