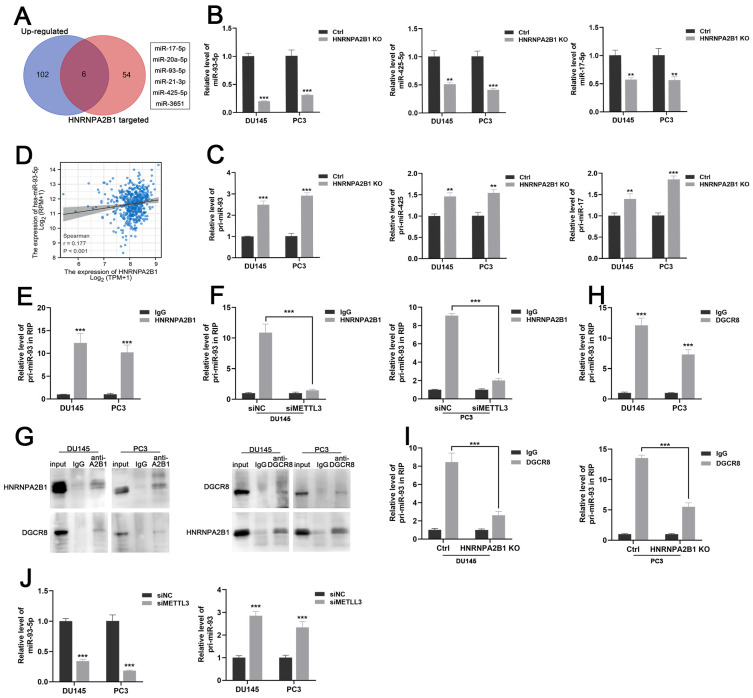
Figure 4.
HNRNPA2B1 promotes miR-93-5p processing in a m6a-dependent manner. (A) Venn diagram presenting the overlap between upregulated miRNAs in PCa dataset of TCGA cohort and HNRNPA2B1-modulated miRNAs. (B) qPCR analyses show the relative expression of mature miR-93-5p, miR-425-5p and miR-17-5p in parental and HNRNPA2B1 knockout PCa cell lines. (C) qPCR analyses show the relative expression of pri-miR-93, pri-miR-425 and pri-miR-17 in parental and HNRNPA2B1 knockout PCa cell lines. (D) The scatterplot image shows the correlation between HNRNPA2B1 and miR-93-5p in TCGA cohort. (E) Result of RIP-qPCR assay detecting pri-miR-93 enriched by antibody of HNRNPA2B1 and IgG in DU145 and PC3 cells. (F) RIP-qPCR assay detecting pri-miR-93 enriched by antibody of HNRNPA2B1 and IgG in PCa cells transfected with METTL3 siRNA. (G) Lysates from DU145 and PC3 cells were subjected to Co-IP with anti-HNRNPA2B1 and anti-DGCR8 (with IgG as negative control). The blots were probed with anti-HNRNPA2B1 and anti-DGCR8 respectively. (H) RIP-qPCR assays detecting pri-miR-93 enriched by antibody of DGCR8 and IgG in DU145 and PC3 cells. (I) RIP-qPCR assay detecting pri-miR-93 enriched by antibody of DGCR8 and IgG in HNRNPA2B1-knockout PCa cells. (J) qPCR analyses show the changes of mature miR-93-5p and pri-miR-93 in DU145 and PC3 transfected with METTL3 siMETTL3. Each experiment was conducted in triplicate; bar graphs are represented as mean ± SD; *P <0.05, **P<0.01, ***P<0.001.

