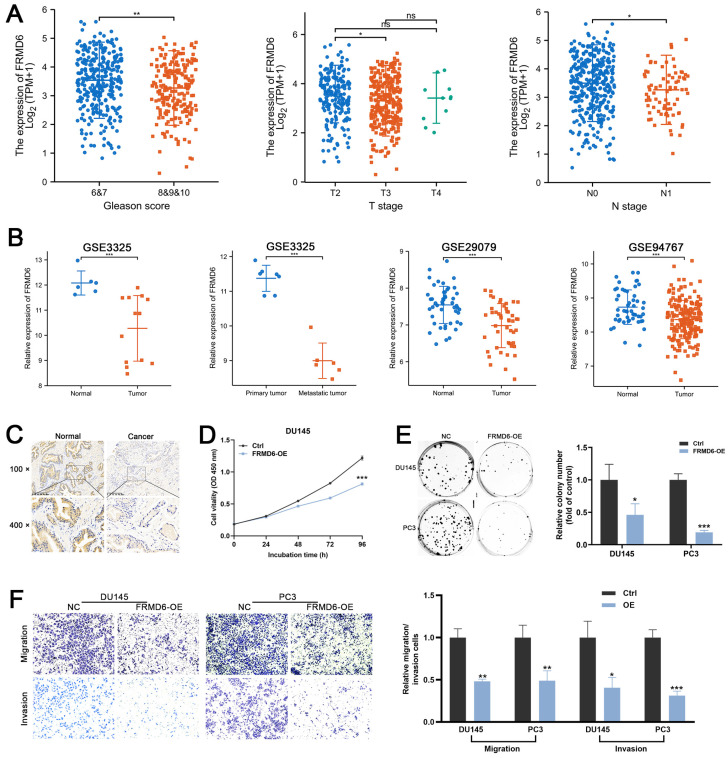
Figure 7.
FRMD6 plays a role of tumor suppressor in PCa (A) The differential analysis of FRMD6 between different T (primary tumor) stage samples, different N (lymph node) stage samples and different Gleason score (<8 versus ≥8) in TCGA cohort. (B) Differential analysis of FRMD6 in GEO datasets (GSE3325, GSE29079 and GSE94767) containing human primary prostate cancer, metastatic prostate cancer samples and normal prostate tissues. (C) Representative FRMD6 IHC staining images of paired PCa and adjacent normal prostate tissues (scale bar, 200 μm). (D) Growth curves show the proliferation ability of FRMD6-overexpressing DU145 cells. (E) Representative wells of colony formation assays of parental and FRMD6-overexpressing DU145 and PC3 cells (left). Quantification of colony formation assay (right). (F) Trans-well migration and matrigel invasion assays of parental and FRMD6-overexpressing DU145 and PC3 cells (representative wells were presented) (left). Quantification of migration and invasion cells in each field (right). Each experiment was conducted in triplicate; bar graphs are represented as mean ± SD; *P <0.05, **P<0.01, ***P<0.001.

