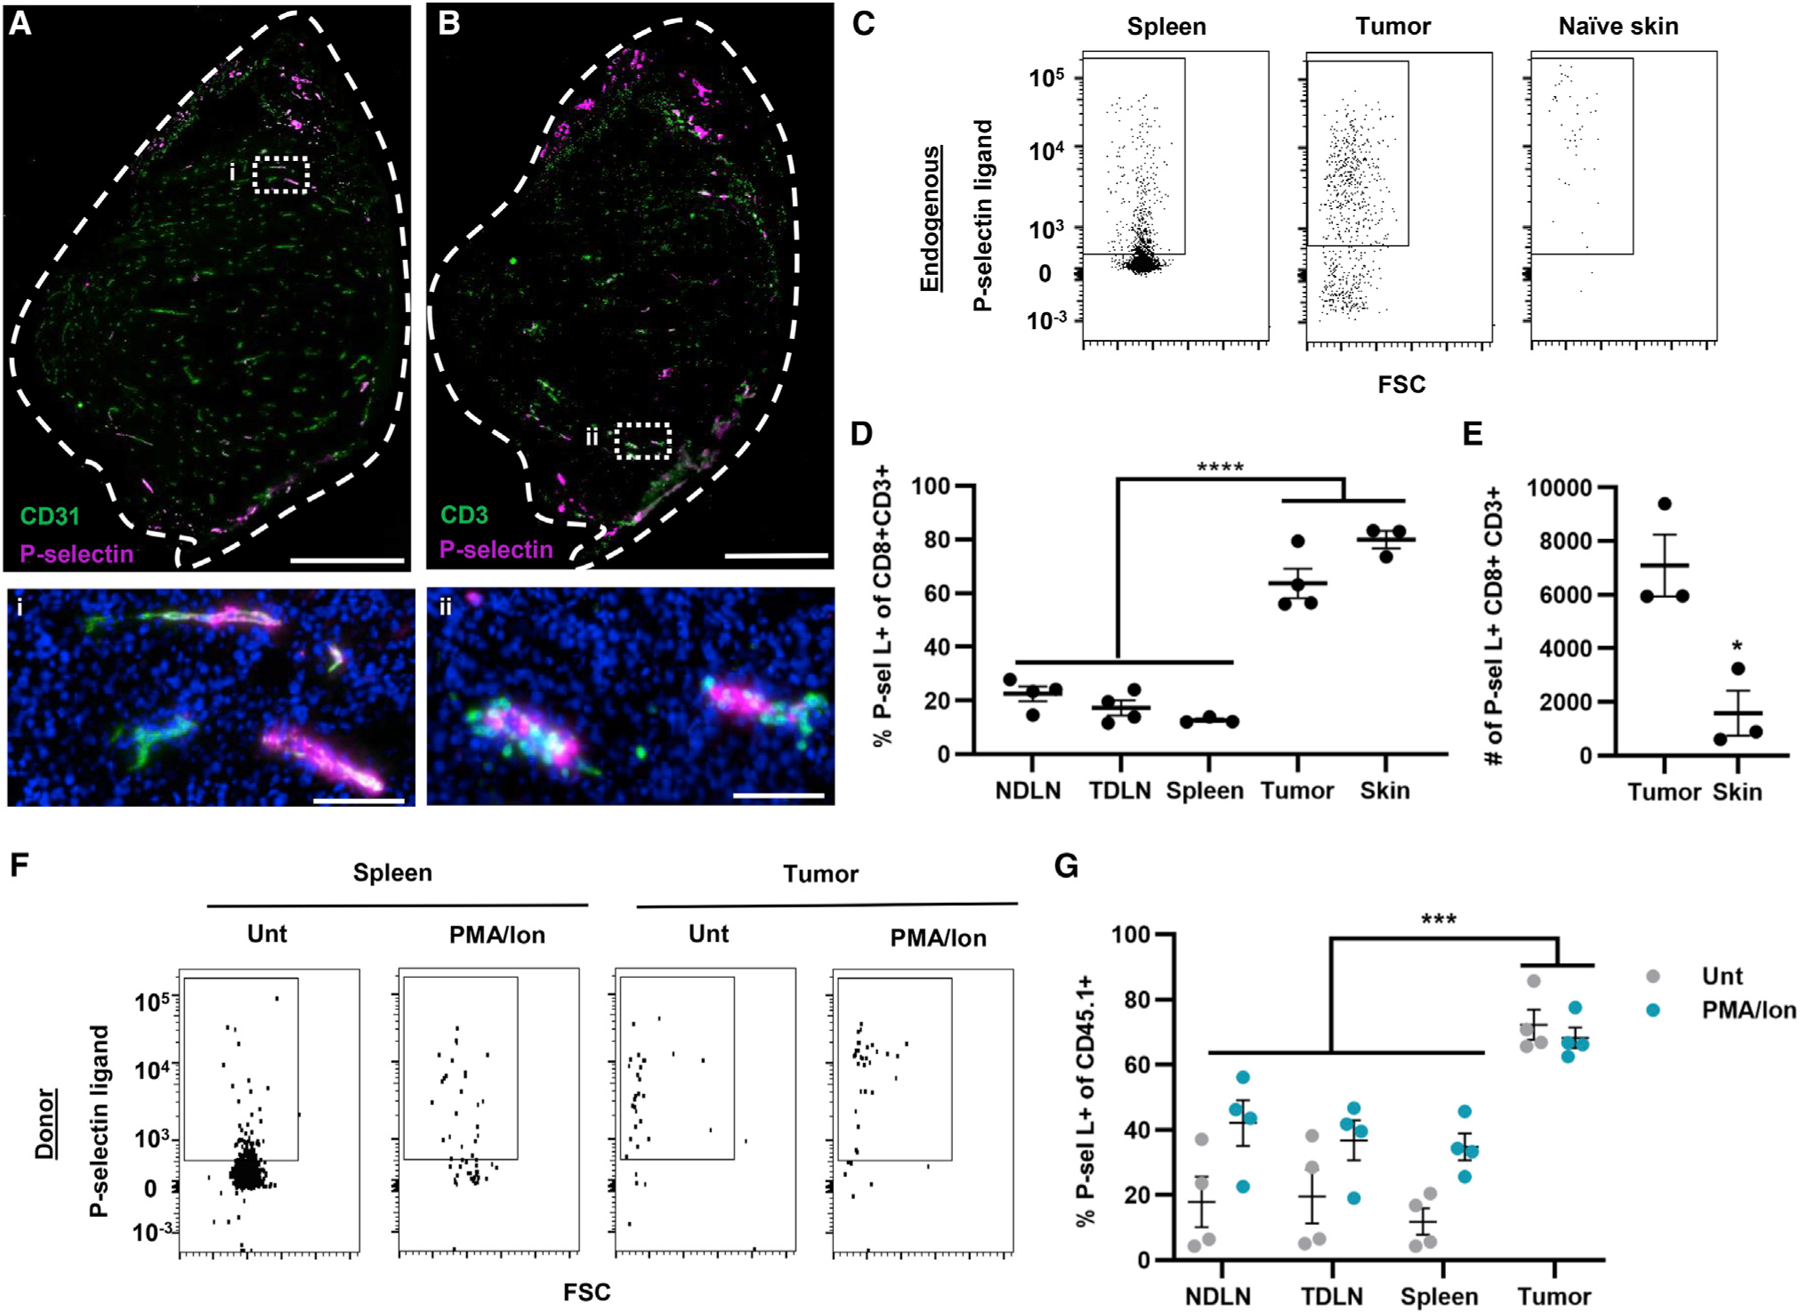
Figure 1. Endogenous and donor CD8+ T cells recovered from the TME are enriched for P-selectin ligand expression compared with lymphoid tissues.

(A and B) Immunohistochemistry staining for P-selectin and CD31 (A) or CD3 (B) in 8-μm-thick sections of B16F10 tumors formed in C57BL/6 mice. Scale bars: top, 400 μm; bottom, 50 μm.
(C) Representative flow cytometry data scatterplots for P-selectin ligand+ expression by CD8+ T cells recovered from the spleen, tumor, and naive skin.
(D) Percentage of CD8+ T cells recovered from the LNs, spleen, tumor, or naive skin expressing P-selectin ligand. Statistical comparisons by one-way ANOVA with Dunnett’s multiple comparisons test.
(E) Total number of P-selectin ligand-expressing (P-sel L+) cells recovered from tumors or naive skin. Statistical comparisons by two-tailed parametric t test.
(F) Representative flow cytometry scatterplots for P-selectin ligand expression by CD45.1+CD8+ T cells recovered from the spleen, tumor, and naive skin 16 h post-adoptive transfer of 106 untreated or PMA/Ion-treated CD45.1+CD8+ T cells into melanoma-bearing mice.
(G) Percentage of transferred CD45.1+CD8+ T cells recovered from various tissues 16 h post-transfer that express P-selectin ligand. Statistical comparisons by two-way ANOVA with Dunnett’s multiple comparisons test. Points represent data from an individual animal. Data in all panels represent the mean ± SEM;
*p < 0.05, ***p < 0.001, ****p < 0.0001. See also Figures S1–S4.
