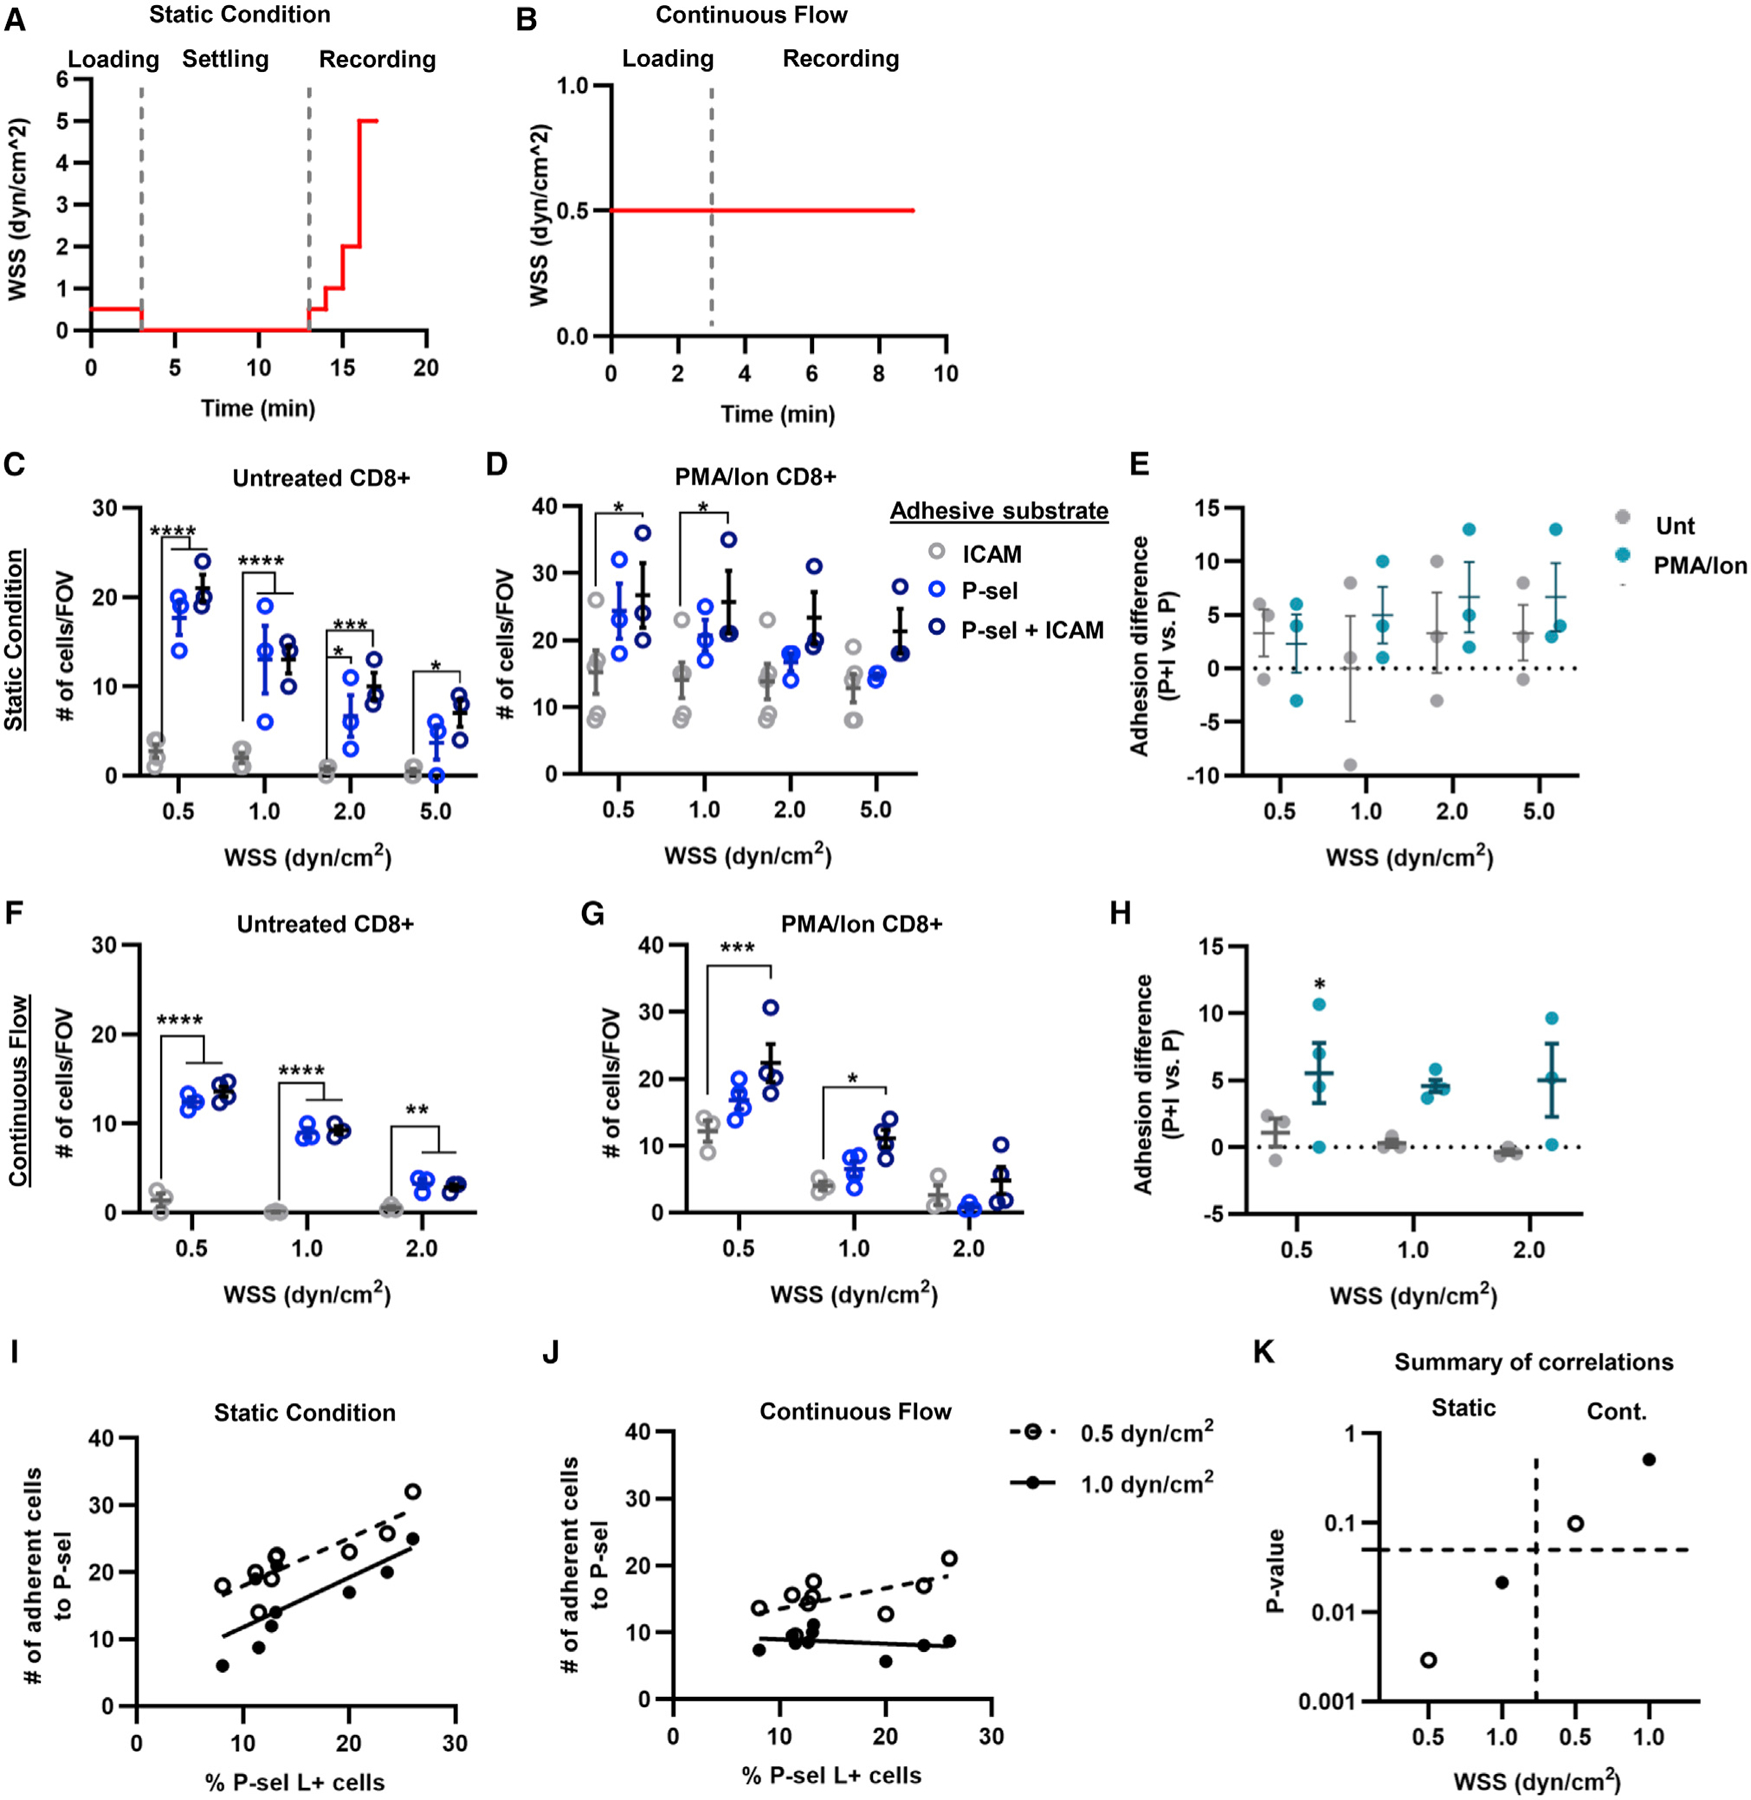
Figure 2. Adhesion of CD8+ T cells to P-selectin-functionalized substrates is not correlated to P-selectin ligand expression under conditions of continuous flow at physiological levels of wall shear stress.

(A and B) Schematics outlining perfusion conditions for adhesion experiments conducted under static (A) and continuous flow (B) conditions.
(C and D) Numbers of untreated (C) or PMA/Ion-treated (D) CD8+ T cells per field view interacting with ICAM, P-selectin, or P-selectin + ICAM functionalized substrate under static conditions.
(E) Differences in total adhesion of perfused CD8+ T cells to P-selectin + ICAM versus P-selectin alone under static conditions.
(F and G) Numbers of untreated (F) or PMA/Ion-treated (G) CD8+ T cells per field view interacting with an ICAM, P-selectin, or P-selectin + ICAM functionalized substrate under continuous flow conditions.
(H) Differences in total adhesion of perfused CD8+ T cells to P-selectin + ICAM versus P-selectin alone under conditions of continuous flow.
(I and J) Correlation analysis between number of adherent cells to P-selectin and percentage of P-selectin ligand+ cells under static (I) or continuous flow (J).
(K) The p values for the correlation analysis between cells adhering to P-selectin under static conditions or continuous flow and the frequency of CD8+ T cells expressing P-selectin ligand; dashed line represents p = 0.05. Data in all panels represent the mean ± SEM of three independently performed experiments. Statistical comparisons performed by two-way ANOVA with Tukey’s multiple comparisons test; *p < 0.05, **p < 0.01. ***p < 0.001, ****p < 0.0001. See also Figures S5 and S6.
