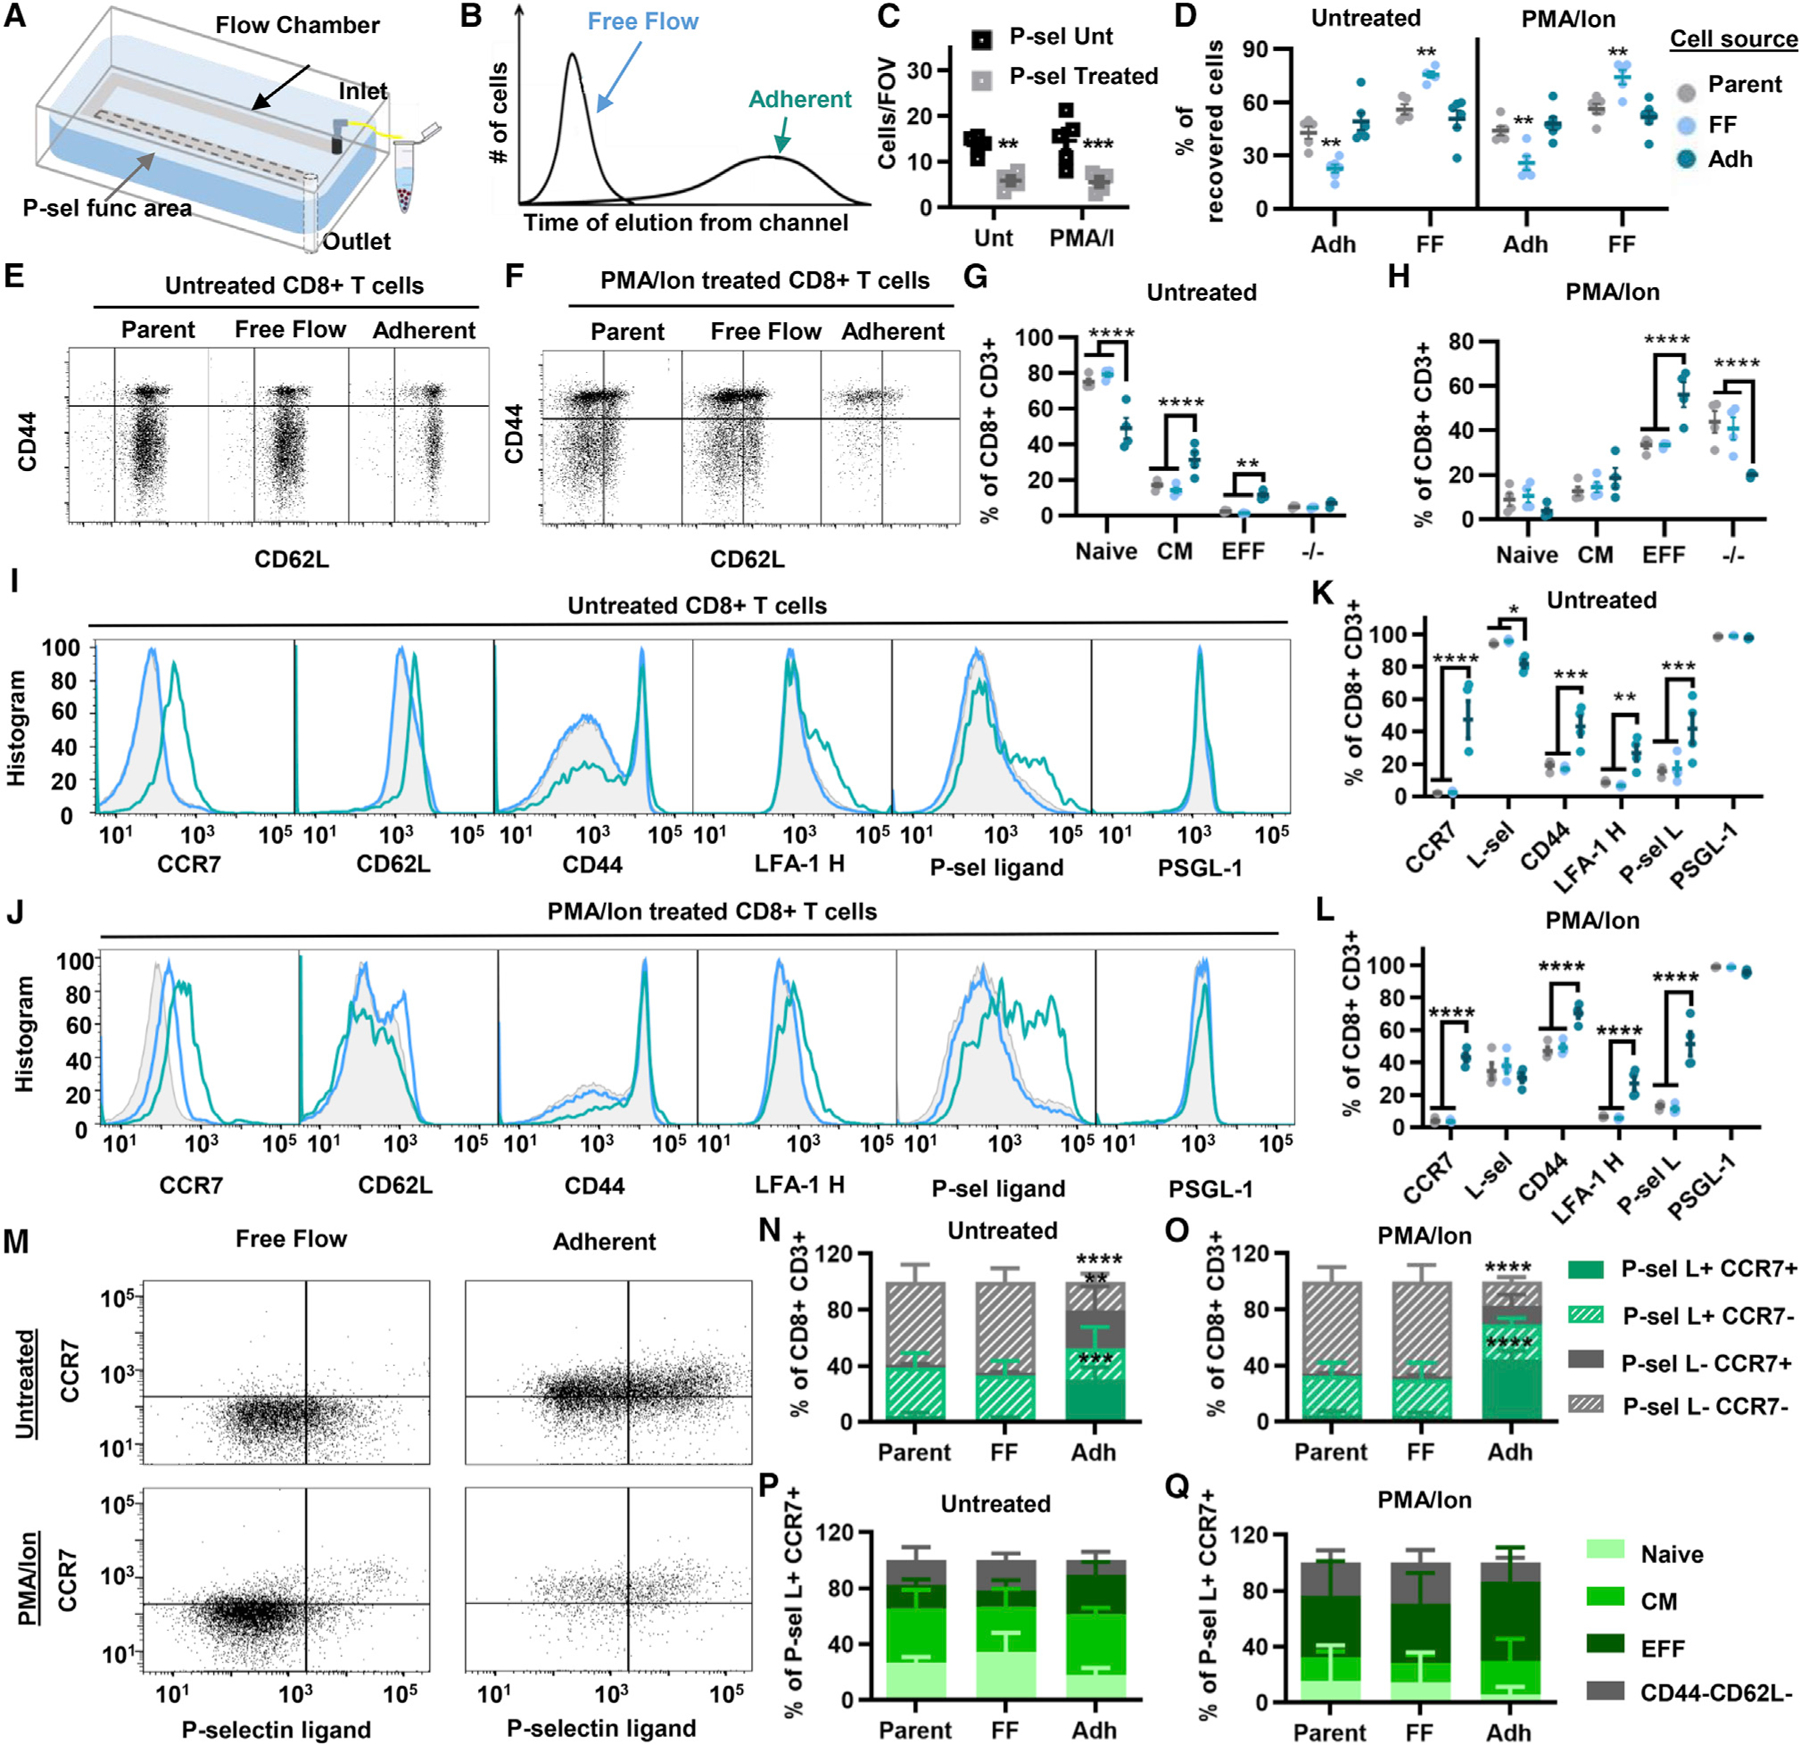
Figure 3. Perfusion of CD8+ T cells through an adhesion chromatography channel functionalized with P-selectin under physiological conditions of fluid flow.

(A) Schematic diagram of hemodynamic microenvironment-mimicking adhesion chromatography microfluidic system.
(B) Schematic diagram of elution times of CD8+ T cells that do (adherent) or do not (free flow) exhibit adhesion to P-selectin.
(C) Number of interacting CD8+ T cells per field of view left untreated or pretreated with P-selectin chimera and perfused through the chromatography channel.
(D) Percentage of recovered untreated or PMA/Ion-treated CD8+ T cells in either the free flow (FF) or the adherent (Adh) fraction of the parent (unsorted) population or reperfused cell subpopulations immediately after perfusion.
(E and F) Gating strategy for fractionated CD8+ T cell subtypes through a P-selectin-functionalized channel. (G and H) Data from (E) and (F), represented as frequency of CD8+ T cells.
(I and J) Representative flow cytometry histograms of different adhesion markers’ expression on parent, FF, and Adh populations. (K and L) Data from (I) and (J), represented as frequency of CD8+ T cells.
(M) Representative flow cytometry plots of CCR7 versus P-selectin ligand expression by free flow or adherent recovered subpopulations from perfused CD8+ T cells left untreated or pretreated with PMA/Ion.
(N and O) Data from (M) represented as frequency of CD8+ T cells.
(P and Q) Frequency of subtypes of P-sel L+CCR7+CD8+ T cells recovered in the different fractions. Points represent results using splenocytes harvested from an individual animal. Data in all panels represent the mean ± SEM. Results represent a minimum of three independently performed experiments. Statistical comparisons performed by two-way ANOVA with Dunnett’s multiple comparisons test; *p < 0.05, **p < 0.01, ***p < 0.001, ****p < 0.0001. See also Figures S7–S9.
