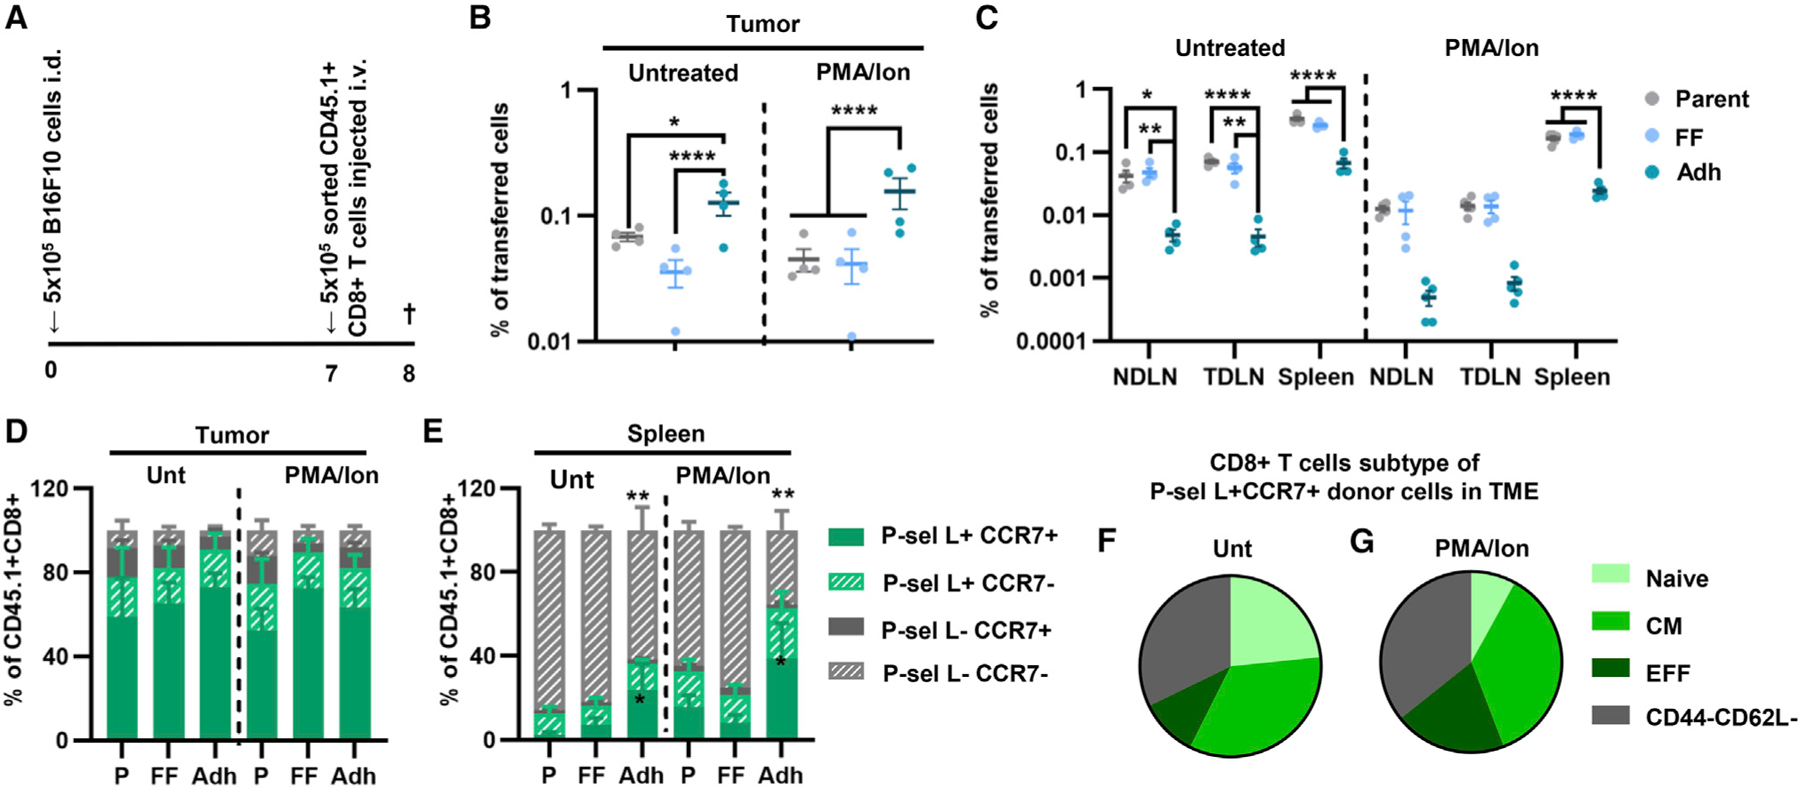
Figure 4. CD8+ T cells recovered using the adhesion chromatography system to enrich for adhesion to P-selectin in flow exhibit enhanced tumor homing compared with cells recovered in the free flow and parent fractions.

(A) Schematic diagram outlining the experimental design.
(B and C) Percentage of parent untreated and PMA/Ion CD8+ T cells of cells fractionated based on their adhesion to P-selectin in flow recovered in various tissues 16 h after adoptive-transfer into B16F10 melanoma-bearing animals.
(D and E) Frequency of single and co-expression of P-selectin ligand and CCR7 by donor CD8+ T cells recovered in the tumor and the spleen that were left untreated or were PMA/Ion treated.
(F and G) Subtype distribution of donor P-sel L+CCR7+ untreated (F) or PMA/Ion-treated (G) CD8+ T cells recovered from the tumor. Points represent individual results from individual animal. Data in all panels represent the mean ± SEM of three or more independently run experiments; two-way ANOVA with Tukey’s multiple comparisons test; *p < 0.05, **p < 0.01, ****p < 0.0001. See also Figure S10.
