
Figure 5. Enrichment of P-selectin ligand and CCR7 expression by Dynabead-expanded CD8+ T cells recovered by perfusion through a P-selectin-functionalized channel is correlated with the enrichment of donor cells trafficking to the TME.
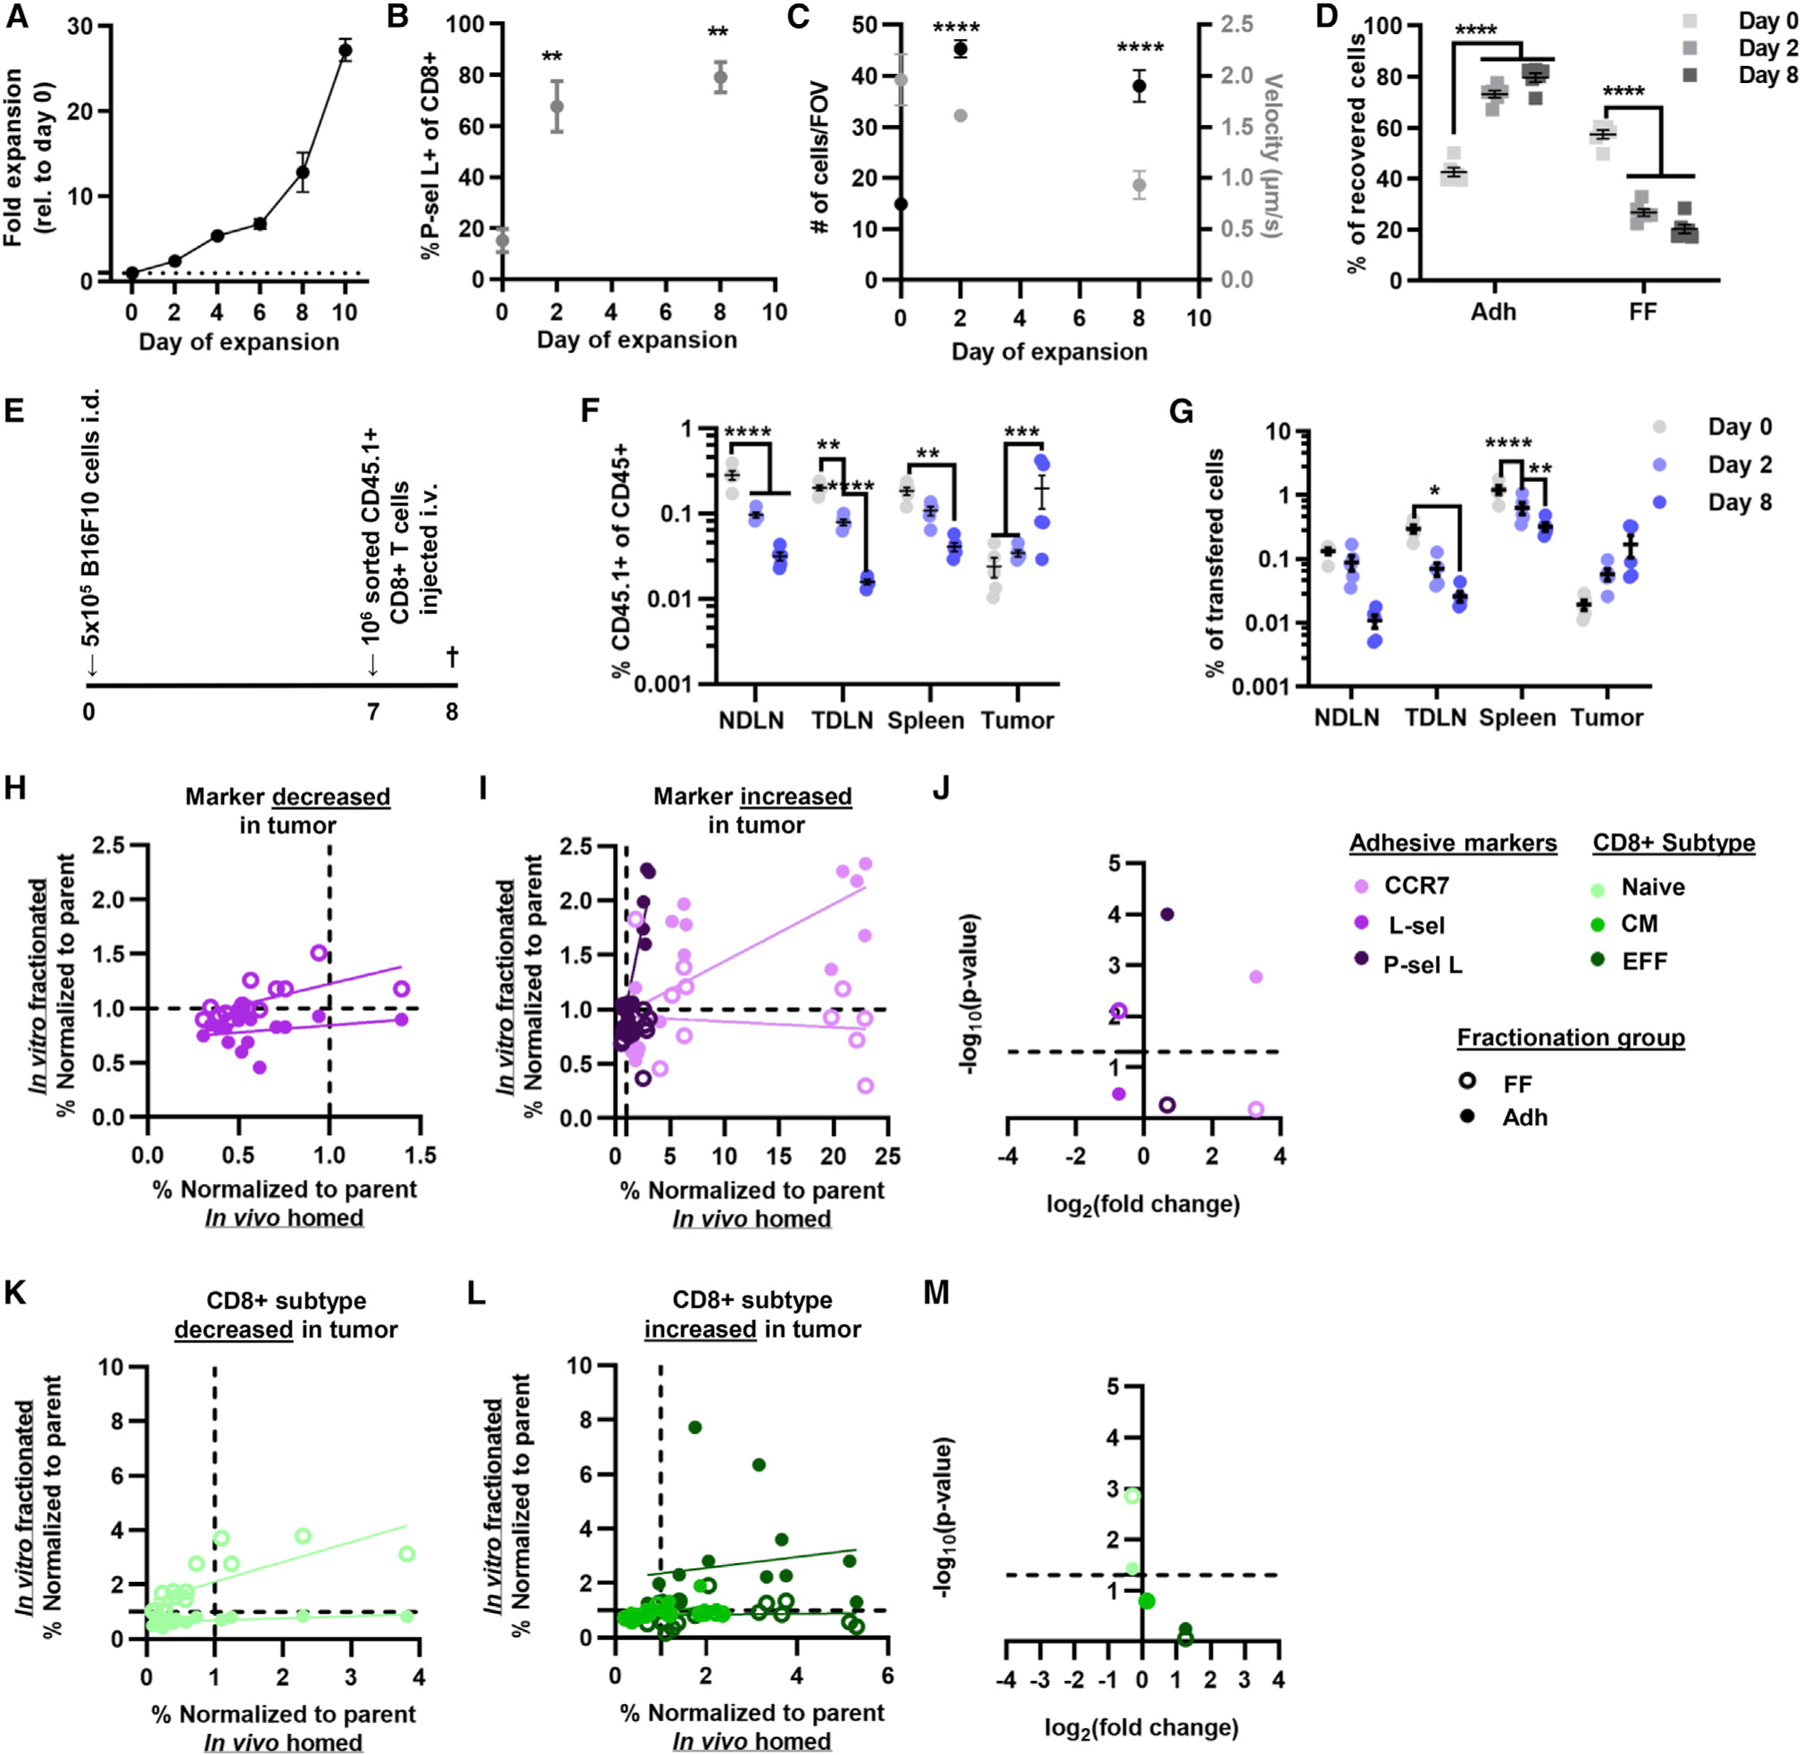
(A) Fold expansion of CD8+ T cells cultured with Dynabeads and IL-2.
(B) Frequency of P-selectin ligand-expressing CD8+ T cells at different days of expansion.
(C) Number and velocity of Dynabead-expanded CD8+ T cells adherent to a P-selectin-functionalized substrate.
(D) Percentage of Dynabead-expanded CD8+ T cells recovered within the Adh and FF fractions by perfusion through the adhesion chromatography system.
(E) Schematic outlining adoptive transfer experimental design.
(F) Frequency of donor CD8+ T cells (CD45.1+CD45.2−) of all CD45+ (CD45.1+CD45.2+) cells into CD45.2 animals bearing B16F10 melanomas.
(G) Frequency of otal CD8+ donor T cells ecovered from analyzed tissues.
(H–M) Correlation analysis of adhesion molecule expression (H and I) and subtype (K and L) enrichment between CD8+ T cells enriched for adhesion to P-selectin in flow and that traffic to the tumors. −log10(p value) versus log2(fold change) of adhesion molecule expression (J) and subtype (M) by CD8+ T cells recovered from the tumor. (F–I, K, and L) Points represent results from one individual animal. (A–D, F, and G) Data represent the mean ± SEM. All data represent results from three or more independently run experiments; one-way ANOVA (B) and two-way ANOVA (C, D, F, and G) with Dunnett’s multiple comparisons test; *p < 0.05, **p < 0.01, ***p < 0.001, ****p < 0.0001. See also Figures S11–S14.