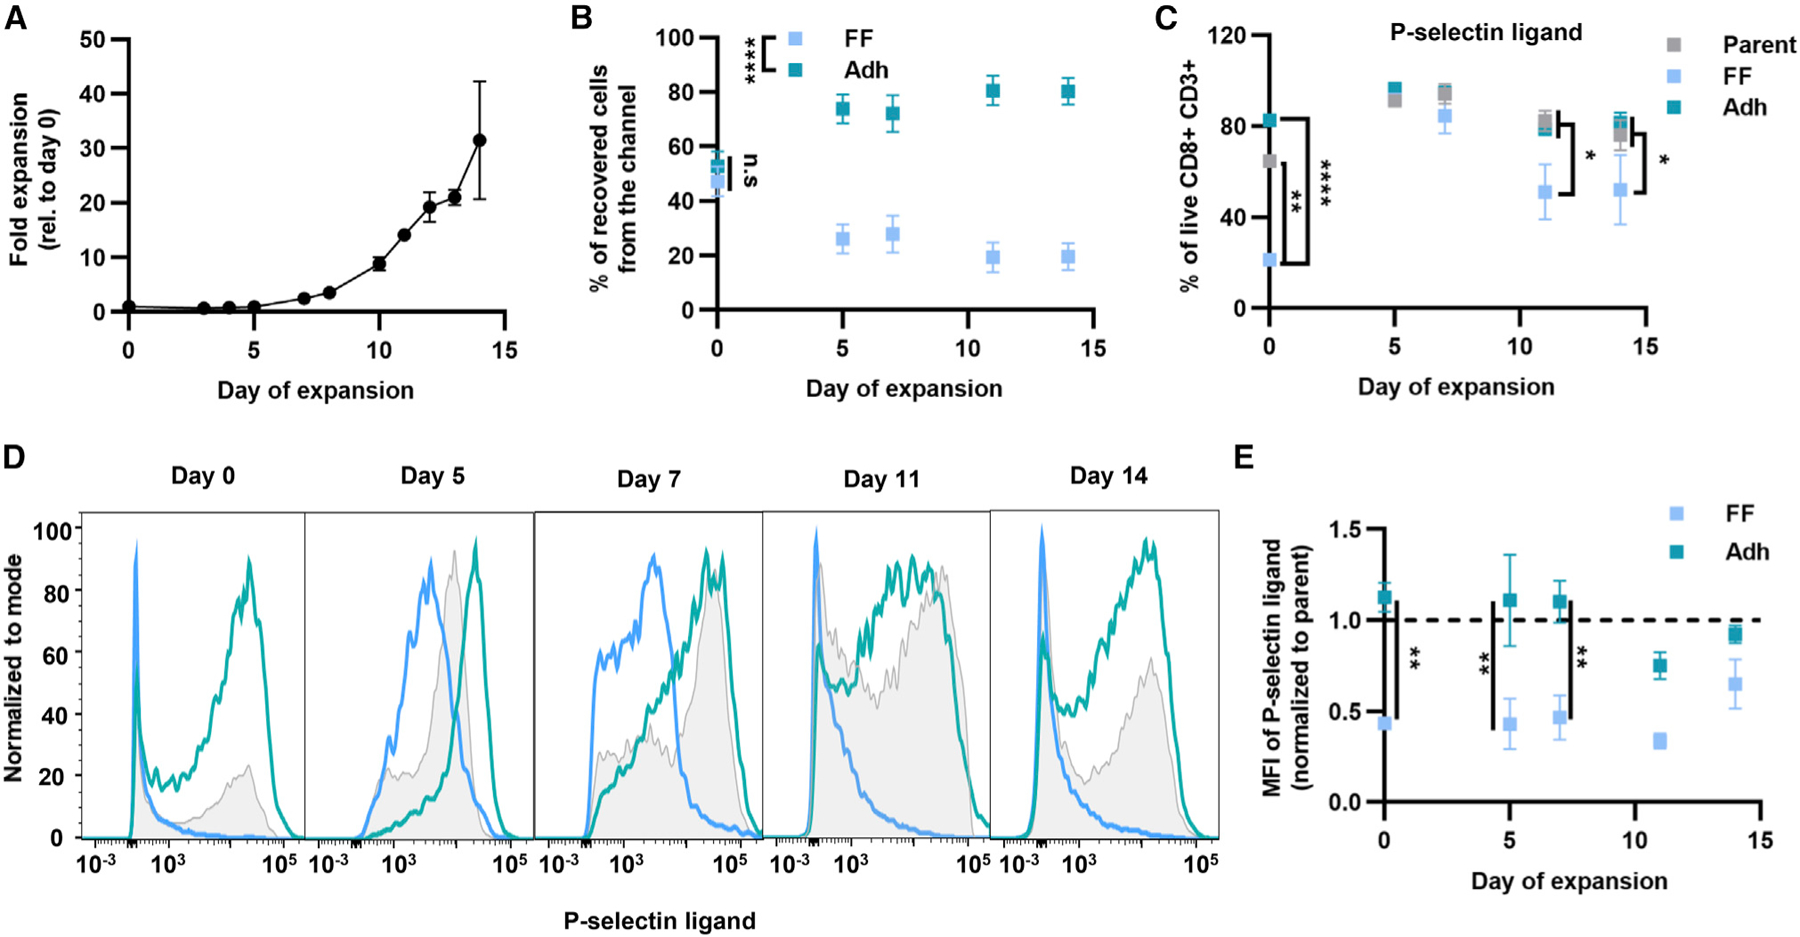
Figure 7. Human CD8+ T cells exhibit differential adhesion to P-selectin in physiological levels of fluid flow during expansion.

(A) Expansion of human CD8+ T cells from healthy donors cultured with Dynabeads and IL-2.
(B) Percentage of CD8+ T cells recovered in Adh and FF fractions using P-selectin-functionalized channel.
(C) Frequency of P-selectin ligand+ cells of live CD8+ T cells of parent populations or those recovered in FF or Adh fractions after perfusion through a P-selectin-functionalized channel at different days of expansion.
(D) Histograms of P-selectin ligand expression at different days of expansion of human CD8+ T cells.
(E) Mean fluorescence intensity of P-selectin ligand+ cells normalized to parent cell mean fluorescence. For all graphs the data represent the mean ± SEM of three or more independently run experiments; two-way ANOVA with Bonferroni’s multiple comparisons test; *p < 0.05, **p < 0.01, ****p < 0.0001. See also Figure S16.
