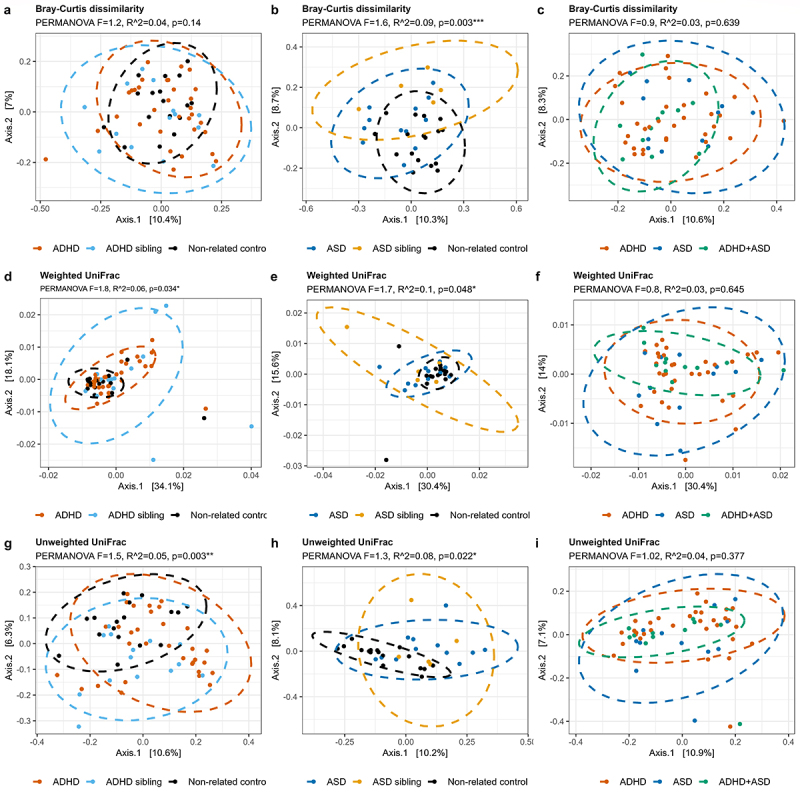
Figure 2.

Beta-diversity of each diagnostic group. The beta-diversity is presented using principal coordinate analysis (PCoA), with either Bray-Curtis dissimilarities (a-c), weighted UniFrac (d-f), or unweighted UniFrac (g-i). The individual groups were analyzed as either ADHD (a, d, and g) or ASD (b, e, and h) compared to the non-related children, or as ADHD, ASD, and comorbid ADHD/ASD compared to each other (c, f, and i). Ellipses depict 95% confidence intervals. PERMANOVA results are indicated with adjusted p-values and R2 and represent the overall differences in beta-diversity. For cases compared to siblings and non-related children combined, see supplementary figure S2. Pairwise PERMANOVA comparisons can be seen in Supplementary data S1, while confounders as fixed effects are found in supplementary data S2.
