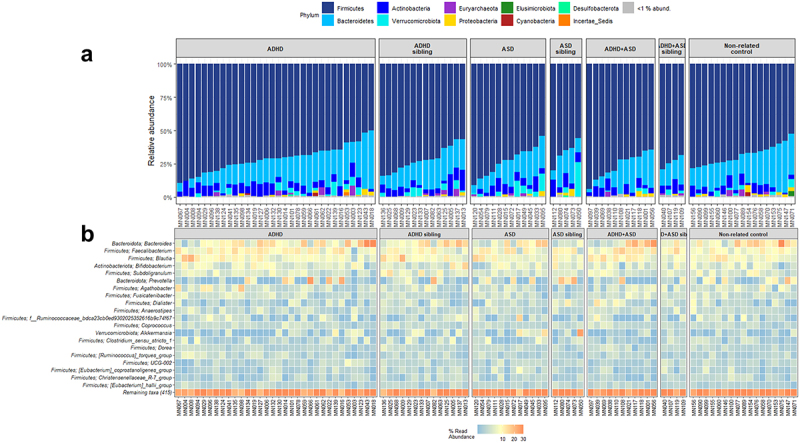
Figure 3.

Composition of bacteria in each diagnostic group. Relative abundance of the individual bacterial at the taxonomic levels phylum (a) and genus (b), depicted as percentage of total bacteria per sample. For phylum, data are represented as a barplot, with a grouping of phyla that comprise<1% of total relative abundance. For ease of interpretation, genera are represented using a heatmap, with the 20 most abundant genera listed.
