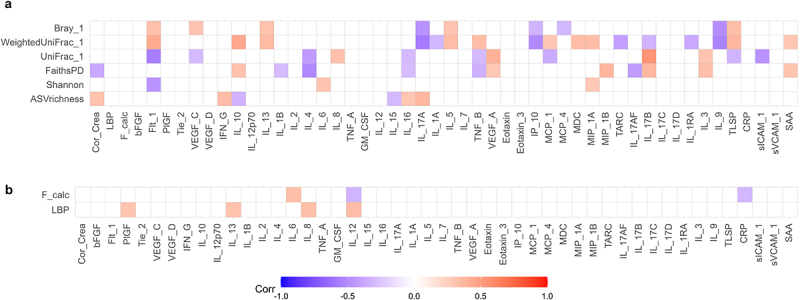
Figure 6.

Multilevel correlation-testing of gut microbiota and intestinal permeability compared to systemic inflammatory markers. Multilevel Spearman’s correlation analysis of the correlation between a) bacterial alpha-and beta-diversity and b) fecal calprotectin and LBP compared to immunoproteomic markers, with sibling pair as random effect. Only correlations with Benjamini-Hochberg adjusted p-values<0.05 are displayed. Blue values indicate a negative correlation (rho−1–0), while red values indicate a positive correlation (rho 0–1). Raw values can be found in supplementary data S4–5. Only study participants with matching feces and plasma samples were include in the analysis.
