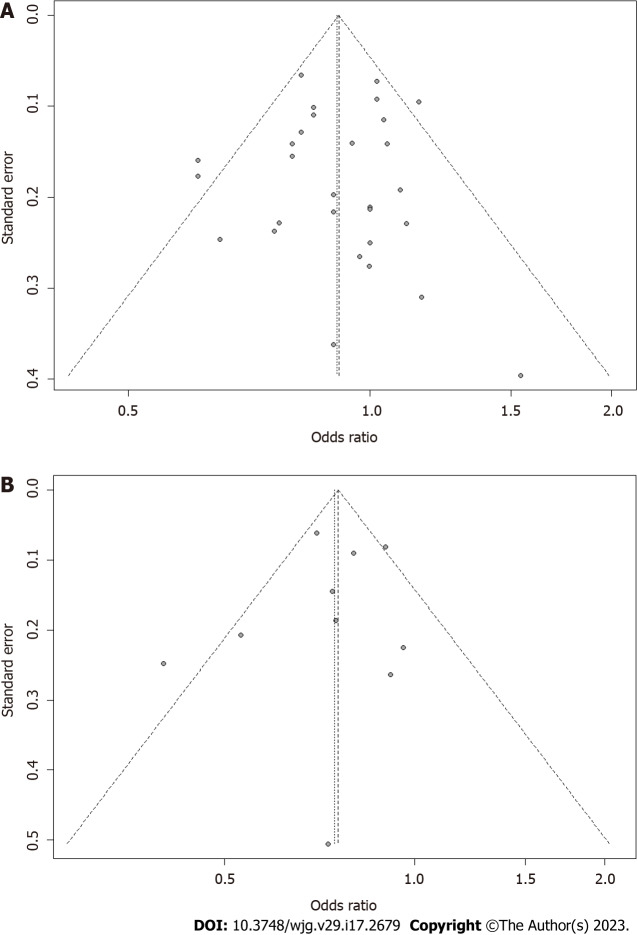
Figure 9.
Funnel plot. A: Funnel plot of studies evaluating for the association between Citrus fruit intake and risk of colorectal cancer. Dotted lines on both sides indicate 95% pseudo-confidence intervals; B: Funnel plot of studies evaluating for the association between Apple intake and risk of colorectal cancer. OR: Odds ratio; CI: Confidence intervals.

