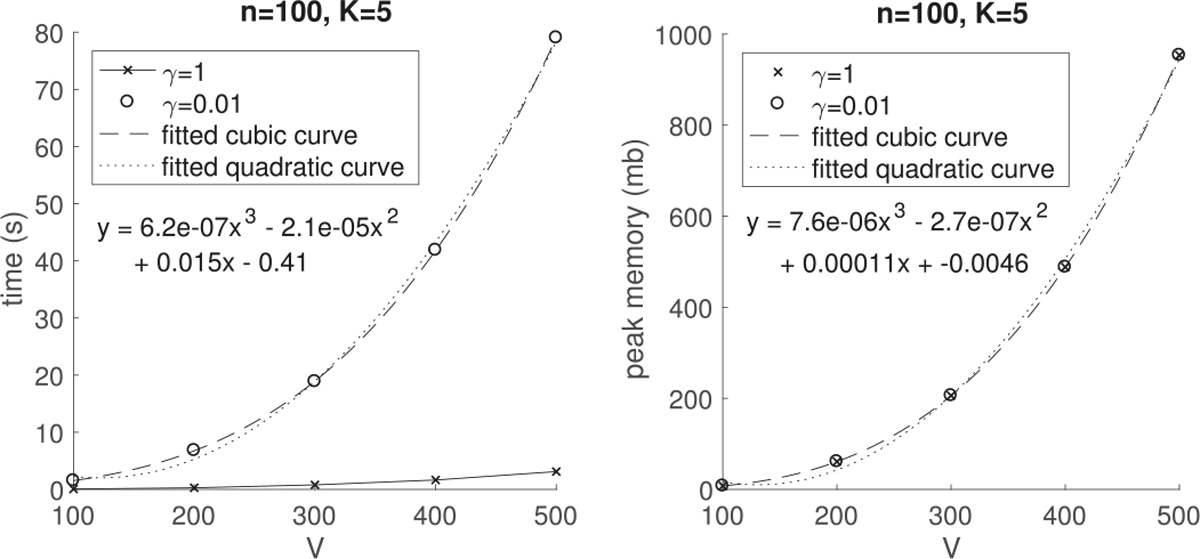
Fig. 2.

Average computation time (in seconds) per iteration (left) and average peak memory (in mb) in use (right) during the execution of Algorithm 1 for 30 runs versus the number of nodes V. The equation of the fitted cubic curve is shown on either plot.
