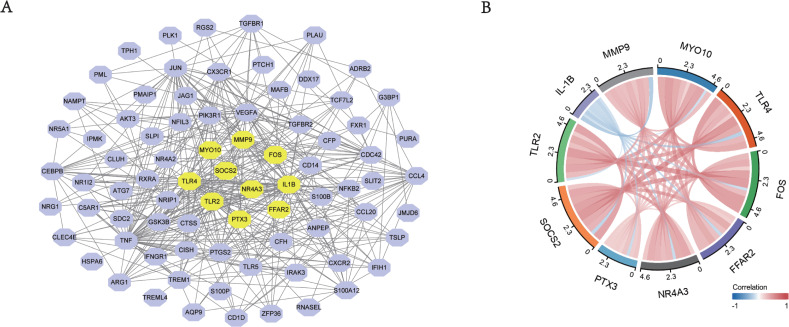
Figure 5. The PPI networks of top DEGs.
(A) All the circles were proteins encoded by top DEGs. Purple color represented the genes that met the criteria, yellow color represented the top 10 most significant genes. The black lines represented the relationship between two genes. (B) Chord diagram of 10 hub genes. The solid lines meant the relationship of every two genes, and the depth of color represented the closeness of their connection.

