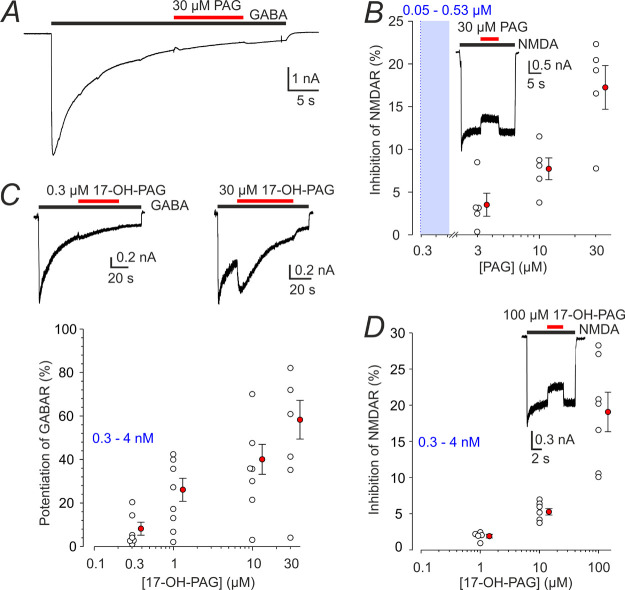
Figure 2.
Effect of PAG and 17-OH-PAG on GABAR and NMDAR responses. (A) Representative recording from a cultured hippocampal neuron shows a response to 1 μM GABA coapplied with PAG (30 μM) (the duration of GABA and steroid application is indicated by black and red bars, respectively). (B) Graph shows the degree of inhibition by PAG of responses to 100 μM NMDA observed in individual neurons (open symbols). Inset shows the effect of 30 μM PAG on a response to 100 μM NMDA. (C) Response to 1 μM GABA was recorded in the absence and presence of 0.3 or 30 μM of 17-OH-PAG. The plot of the relative 17-OH-PAG (0.3–30 μM)-induced potentiation of current responses to 1 μM GABA, as assessed for the first GABA and steroid co-application in each neuron. The data assessed in individual cells (open symbols) are plotted normalized with respect to the response induced by 1 μM GABA just preceding GABA and steroid co-application. (D) The graph shows the degree of inhibition by 17-OH-PAG (1–100 μM) of responses to 100 μM NMDA observed in individual neurons (open symbols). Inset shows the effect of 100 μM 17-OH-PAG on a response to 100 μM NMDA. The red-filled symbols in B–D give mean ± SEM. The blue box and numbers indicate a 5–95% confidence interval of the steroid concentrations found in HC following i.p. PAG application (data from Table 1). DMSO concentration in the control and extracellular solution (ECS) with steroids was 1%.

