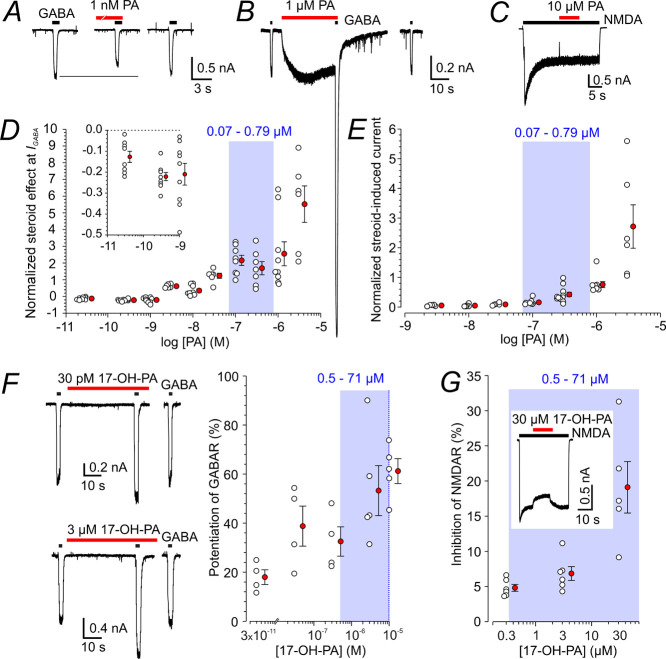
Figure 3.
Modulation of GABAR and NMDAR responses by PA and 17-OH-PA. (A) Representative responses are shown for the first 1 μM GABA application and when co-applied with 1 nM PA following 1 nM PA pre-application for 40 s. (B) Responses are shown for the first 1 μM GABA application and to the first co-application of 1 μM GABA and 1 μM PA made immediately following 1 μM PA pre-application for 30 s. Note that PA (1 μM) alone induced a membrane current that was of a similar amplitude as the current induced by 1 μM GABA. (C) Response to 100 μM NMDA before and during 10 μM PA co-application. (D) The plot of the relative PA (30 pM to 3 μM) effect on responses to 1 μM GABA. Responses to PA and GABA co-application were assessed following 40 s PA pre-application only for the first steroid and GABA co-application in each neuron. Data from individual cells (open symbols) are plotted normalized with respect to the control response induced by 1 μM GABA. Inset shows the data for 30 pM to 1 nM PA on the expanded y-axis. (E) Plot of the relative PA (3 nM to 3 μM)-induced current assessed for the first steroid application in each neuron. Data from individual cells (open symbols) are plotted normalized with respect to the control response induced by 1 μM GABA. (F) First response to 1 μM GABA recorded after attaining whole-cell configuration in the absence and in the presence of 30 pM (above) or 3 μM (below; different cell) 17-OH-PA. The plot of the relative 17-OH-PA (30 pM to 10 μM) potentiation of responses to 1 μM GABA assessed for the first steroid and GABA co-application in each neuron. Data from individual cells (open symbols) are plotted normalized with respect to the response induced by 1 μM GABA. (G) Plot of the relative 17-OH-PA (0.3–30 μM) effect on steady-state responses to 100 μM NMDA (open symbols). Inset shows a response to 100 μM NMDA induced before and during 30 μM 17-OH-PA co-application. The red-filled symbols next to the open symbols in D-G give mean ± SEM. Blue boxes and numbers in blue in D–G indicate a 5–95% confidence interval of PA and 17-OH-PA concentration measured in HC following i.p. PAG application (Table 1). DMSO concentration in the control and ECS with steroids was 1%.

