
Figure 3: Tregs directly contact Teffs in the skin during vitiligo.
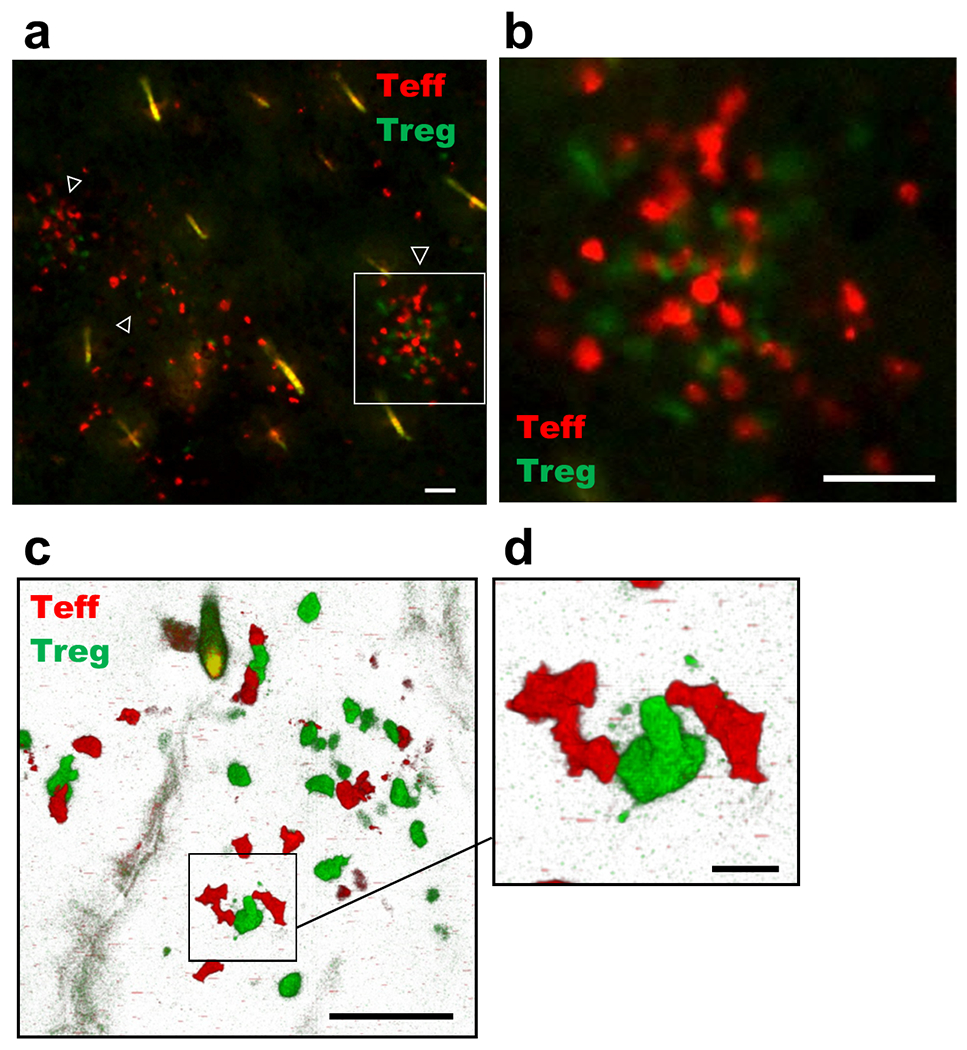
(a) Representative en-face florescent microscopy image depicting GFP+ Tregs and RFP+ Teffs in lesional mouse ear skin; white arrows highlight clusters of Tregs and Teffs, 20x image, bar = 50μM. The area defined by the white box is magnified in (b), 20x image, bar = 50 μM. (c) Representative confocal microscopy image depicting GFP+ Tregs and RFP+ Teffs in lesional mouse ear skin, 40x image; bar = 50μM. The area defined by the black box is magnified in (d), 40x image; bar = 10μM. Imaging experiments were performed 5 weeks post disease induction.