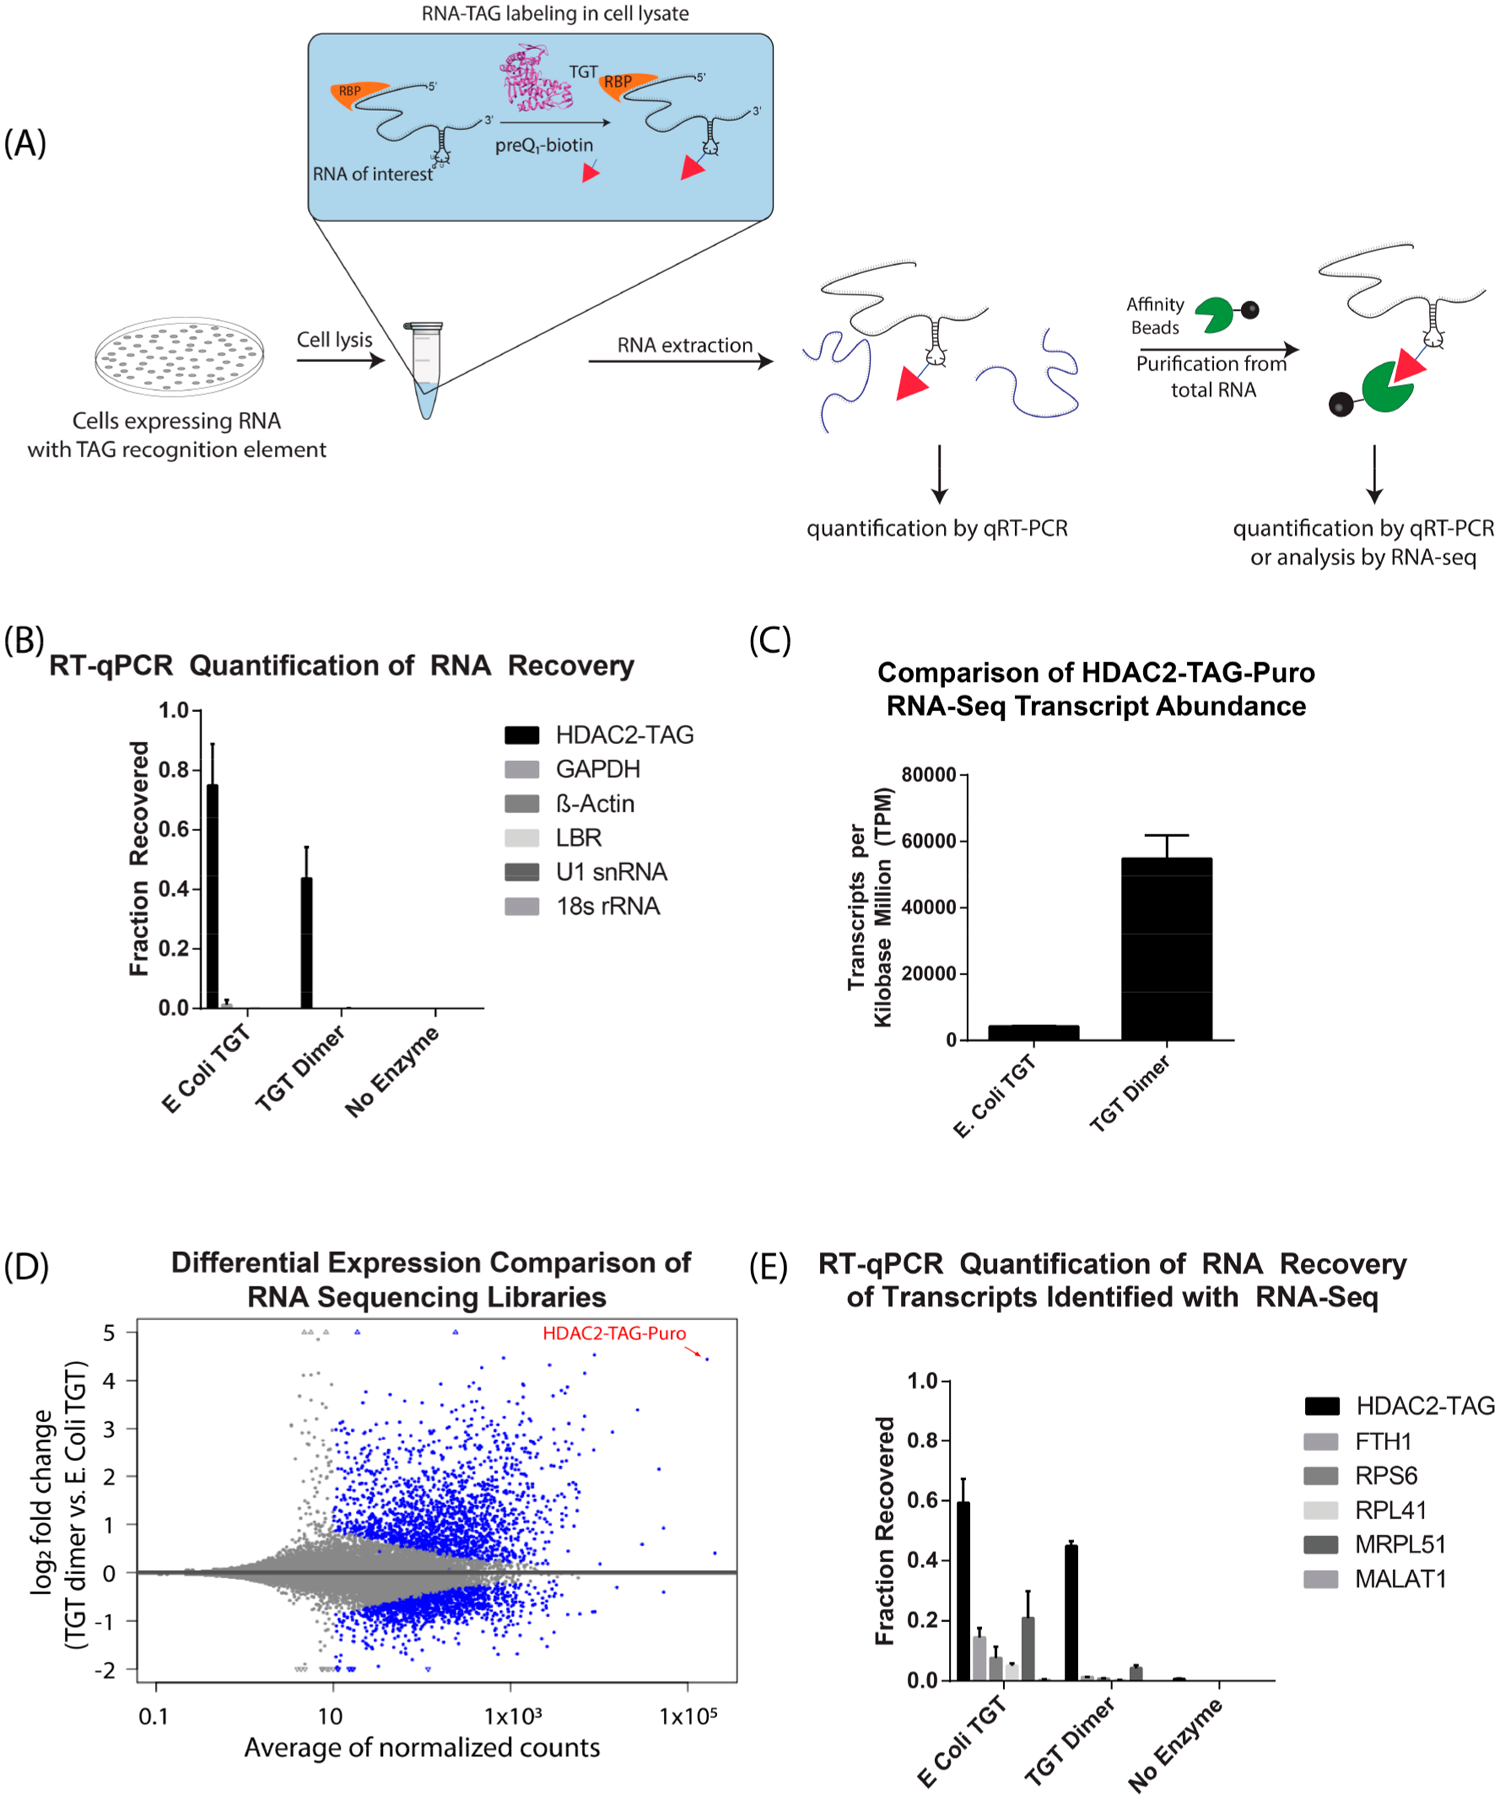
Figure 5.

RNAs expressed in cells can be biotinylated efficiently and selectively in cell lysates. (A) Schematic of RNA labeling in cell lysate and RT-qPCR analysis. Cell lysates are supplemented with TGT enzyme and preQ1-biotin. Subsequently, RNA is extracted for affinity purification and analysis (B) Fraction of RNA recovered after cell lysate labeling was calculated (mean ± S.D, N = 3) by comparison of purified RNA to an input RNA sample, as described in methods. (C) Transcripts per kilobase million (TPM) of target HDAC2-TAG-Puro transcript in RNA sequencing libraries (mean ± S.D, N = 3). (D) Scatter plot of log2 fold change between TGT dimer and E. coli TGT versus mean expression (average of normalized counts). The blue color marks genes detected as differentially expressed at 10% false discovery rate with Benjamini-Hochberg testing (p-value <0.1). The triangle symbols at the upper and lower plot border indicate transcripts with very large or infinite log2 fold change. The HDAC-TAG-Puro transcript is located at the top right corner of the plot and pointed by a red arrow. (E) Fraction of RNA recovered after cell lysate labeling was calculated for RNAs detected in the sequencing libraries (mean ± S.D, N = 3).
