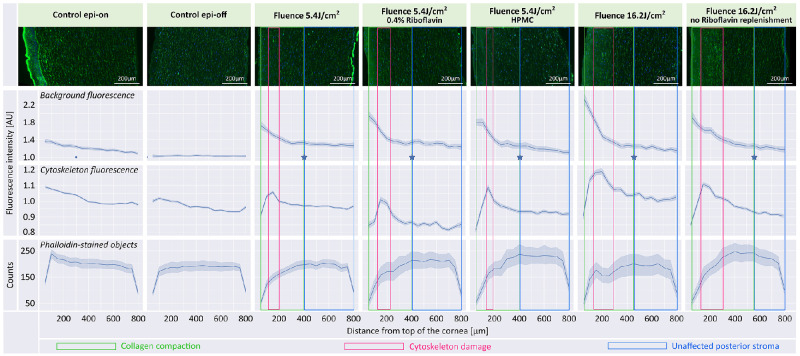
Figure 4.
Effects of PACK-CXL modifications on treatment depth. Top row of graphs: Overall fluorescent signal intensity, including background, as a function of distance from the anterior corneal stromal surface. Middle row of graphs: Actin cytoskeleton fluorescent signal intensity, no background, as a function of distance from the anterior corneal stromal surface. Bottom row of graphs: Phalloidin stained object (actin cytoskeleton) counts as a function of distance from the anterior corneal stromal surface. The light blue intervals in the graphs are 95% confidence intervals computed by grouping images. The blue stars in the background fluorescence graphs represent the transition between the anterior zone of collagen compaction (boxed in green areas), and the unaffected posterior stroma (boxed in blue areas). Placement of the blue stars is based on computed derivative values, and assumed to indicate the PACK-CXL treatment depth. The treatment group “Fluence 16.2 J/cm2 no Riboflavin replenishment” demonstrates the deepest treatment effect. A decrease in phalloidin-stained object counts and a peak in cytoskeleton fluorescence (boxed in pink areas) are visible in the anterior stroma in all PACK-CXL treated groups. These changes are likely related to PACK-CXL treatment-induced cell damage and cell loss. AU, arbitrary units.

