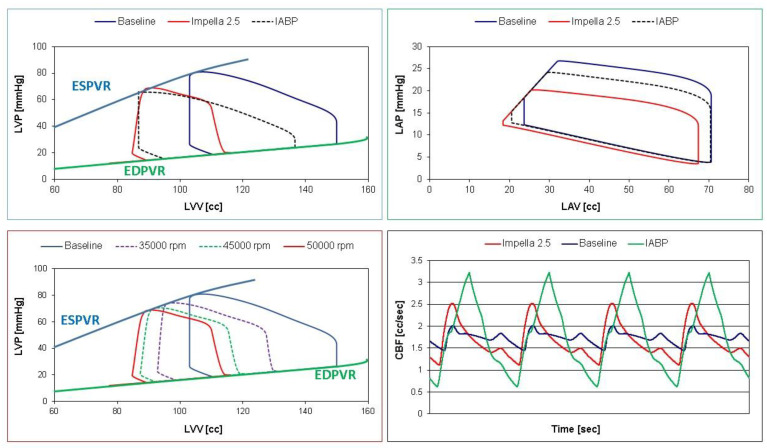
Figure 9.
Left ventricular pressure–volume loops (top and bottom left panels) and coronary blood flow waveforms (bottom right panel) obtained storing data in Excel file and subsequently processed with Excel software. The (top left (right) panel) shows the left ventricular (atrial) pressure–volume loops obtained in baseline (blue continuous lines) and assisted conditions with IABP (Pd = 260 and Pv = −10 mmHg—dashed black lines) and Impella 2.5 (red lines) at 50,000 rpm. The (bottom left panel) shows the left ventricular pressure–volume loops obtained in baseline (blue continuous lines) and assisted conditions with LVAD rotational speed at 35,000, 45,000 and 50,000 rpm.

