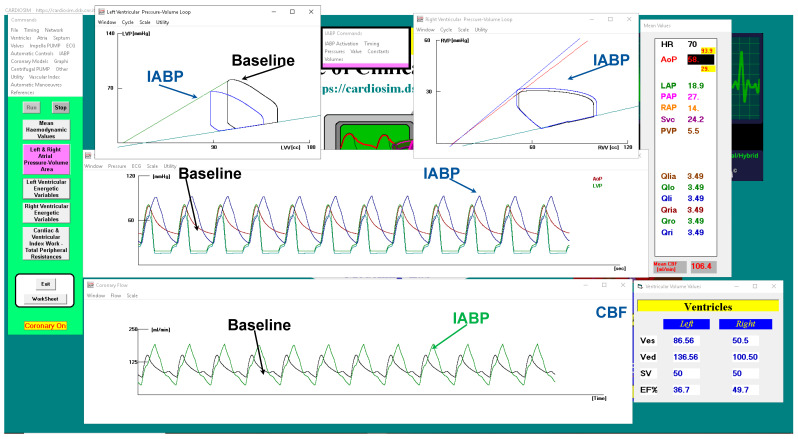
Figure 10.
CARDIOSIM© screenshot showing baseline and assisted conditions with IABP. Proceeding from the top left to the right and then down, the left (top left side) and right (top right side) ventricular pressure–volume loops for baseline and IABP support are observed. The left ventricular and aortic pressure waveforms for baseline (red line) and IABP assistance (blue line) are plotted in the middle window. The bottom window shows the coronary blood flow waveforms.

