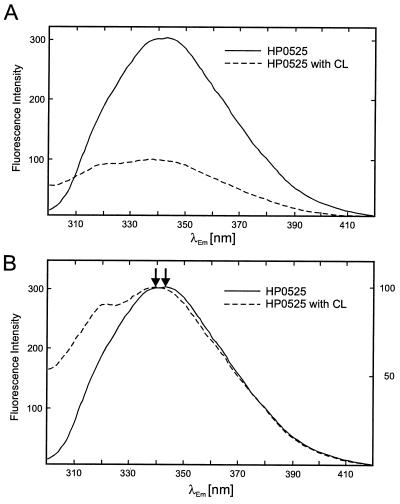
FIG. 7.
Fluorescence spectroscopy of cag HP0525. (A) Quenching of HP0525 fluorescence in the presence of CL; continuous line, the fluorescence spectrum of HP0525 was measured at a protein concentration of 25 μg/ml in 20 mM Tris-HCl [pH 7.6], 50 mM NaCl, and 0.1 mM EDTA. Parameters for fluorescence measurement were as described in the legend to Fig. 6. Dotted line, CL was added as a sonicated suspension to a final concentration of 100 μg/ml. The HP0525-CL mixture was incubated for 30 min at 37°C, and the fluorescence spectrum was recorded as described above. (B) Same as for panel A; however, the peak intensities of the spectra are equalized. The HP0525 emission maxima in the absence and presence of CL are marked by arrows. Arbitrary units for fluorescence intensities in the absence and presence of CL are given on the left- and right-hand side of the spectrum, respectively.

