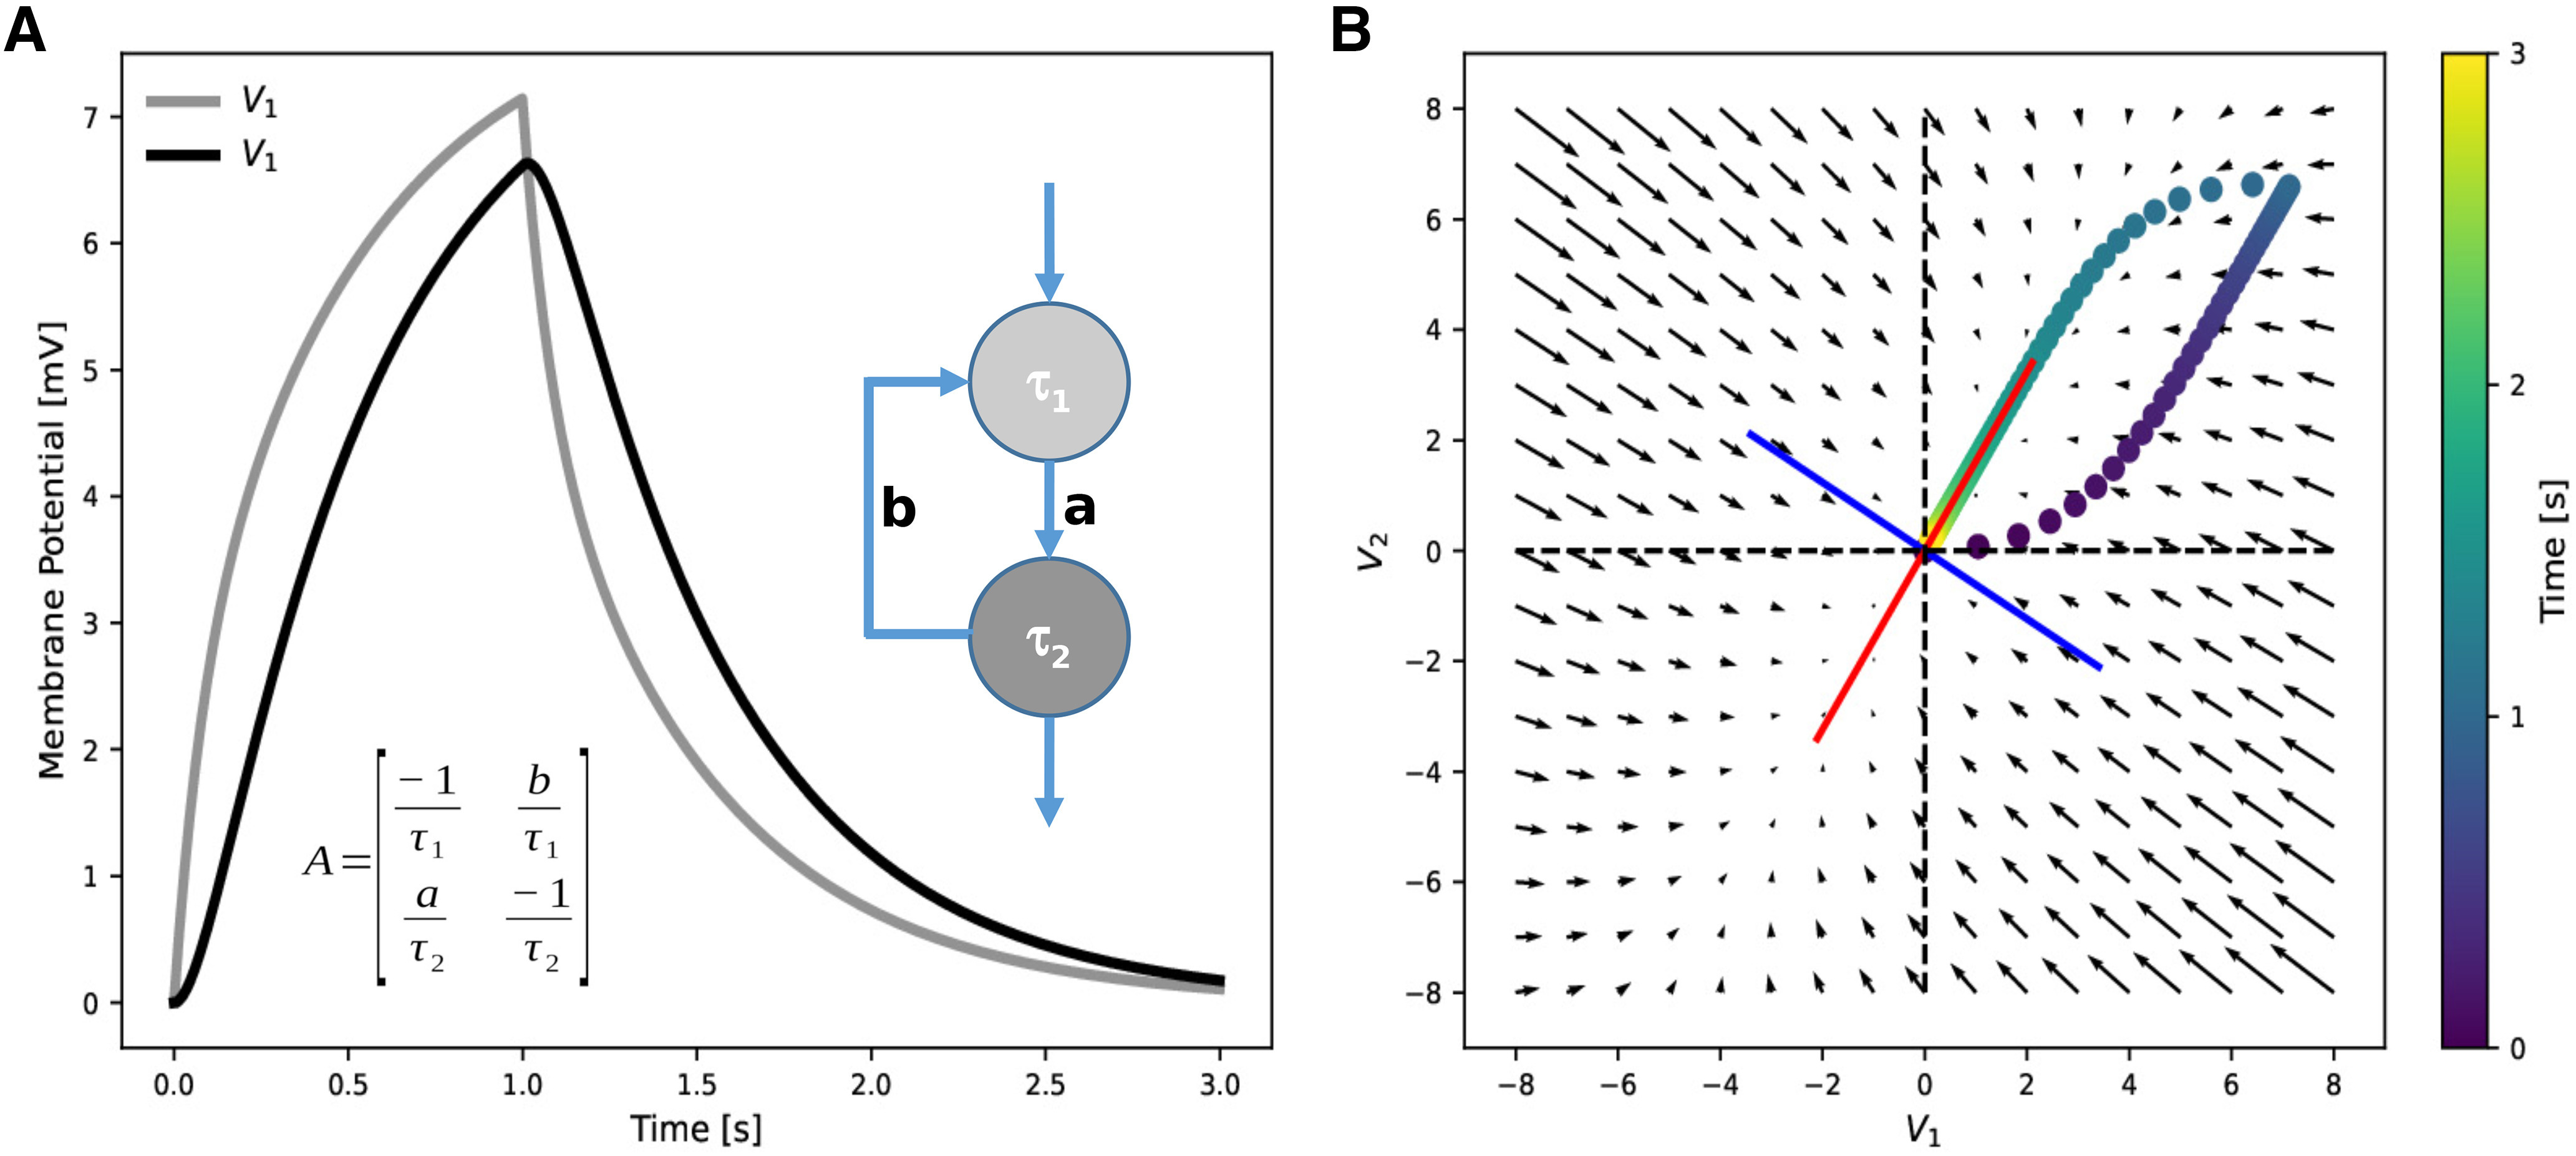
Figure 3.

Time course of voltage signals and phase space of a 2-neuron circuit. A, Analytical solutions of the membrane potentials of two neurons (light and dark gray) in a feedback circuit on a 1 s constant input to neuron 1. The dynamical matrix A includes both neuronal (τ1, τ2) and connectivity (a,b) parameters. Solutions were obtained for a = 1, b = 0.5, τ1 = 0.1 s, τ2 = 0.2 s. B, Graphical representation of the matrix from A (arrows) and its eigenvectors (red, blue). The trajectory V2 versus V1 from A (color dots) follows the vectors representing the matrix after the stimulus is switched off (1 s) and converges to the direction of the red eigenvector.
