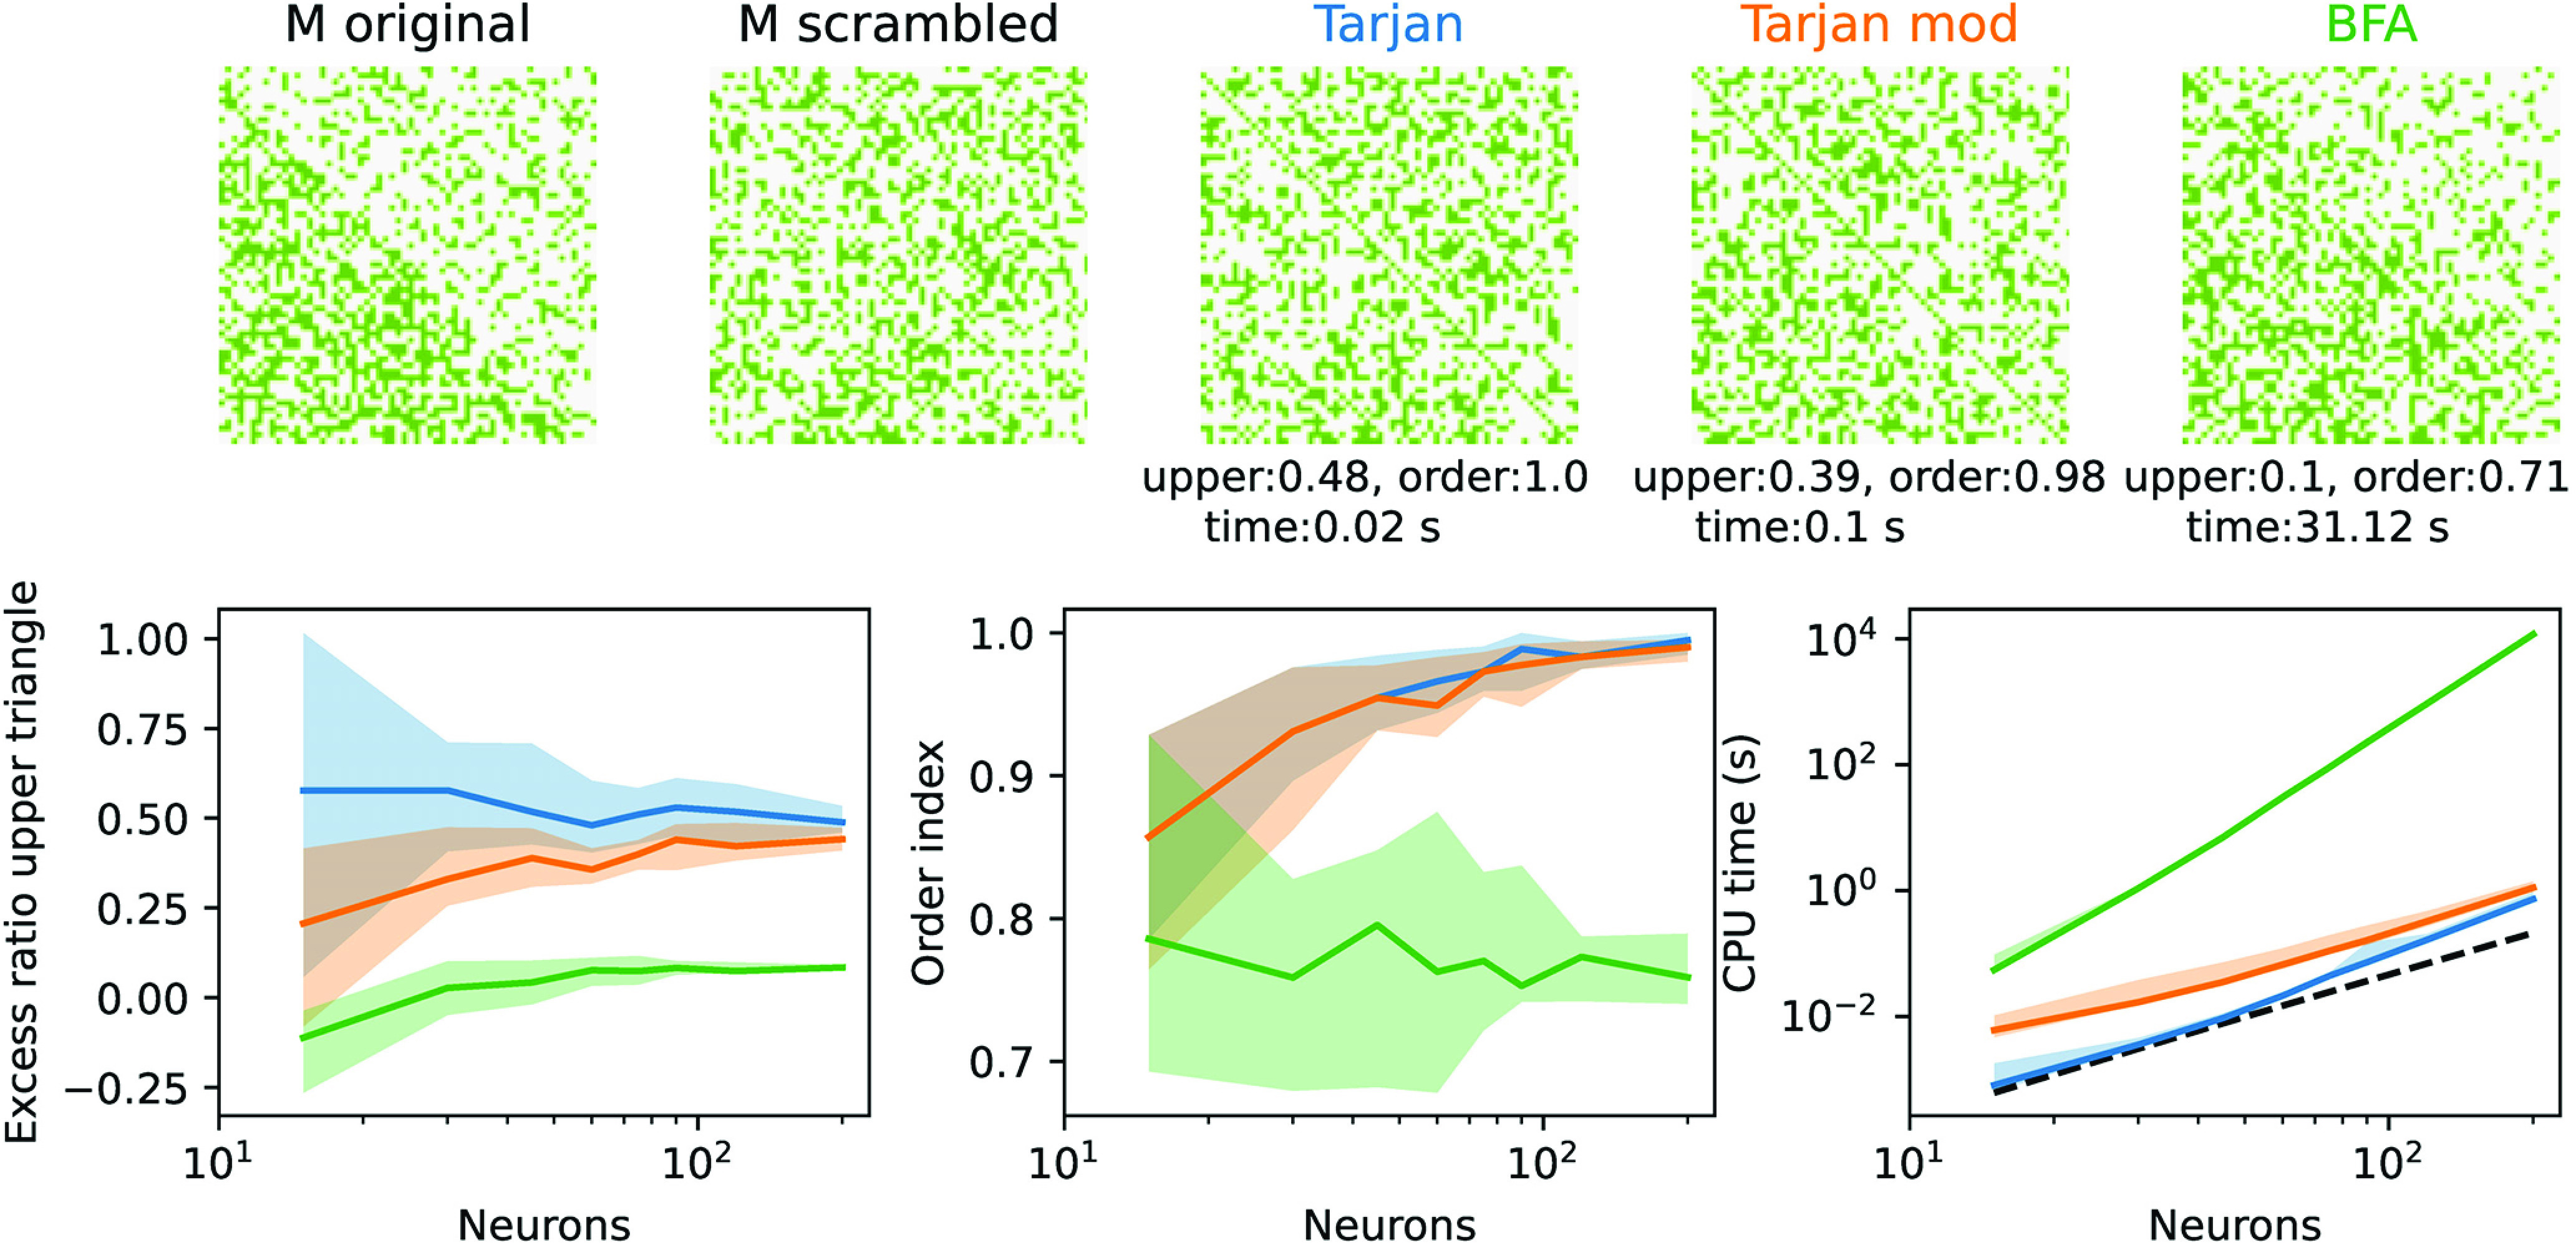
Figure 7.

Scaling of reordering algorithms. Top, Example of a random binary 60 × 60 matrix M with half of the edges filled in the lower and a quarter of edges filled in the top triangle (and no self-connections). After random index permutation (scrambled), we applied three reordering algorithms, the two graph-based methods from Figure 6A, and a brute-force approach (BFA) minimizing the entries in the top triangle as explained in the text. The performance of the reordering is quantified by three measures. The excess ratio in the top triangle (top) measures the increase of entries in the top triangle relative to the original matrix. The Order index measures the fraction of filled entries in the first subdiagonal in the bottom triangle and reveals the extent to which the algorithm has identified a closed path from a first to a last node. Finally, the CPU time used on a standard PC indicates the applicability of the algorithm to large connectomes. Bottom, Three performance measures as a function of node number (colors as on top). Solid lines indicate the median and the area of the 90th percentile obtained from 15 repetitions. Dashed black line on the right indicates the theoretical scaling law (multiplied by an arbitrary constant for better comparison).
