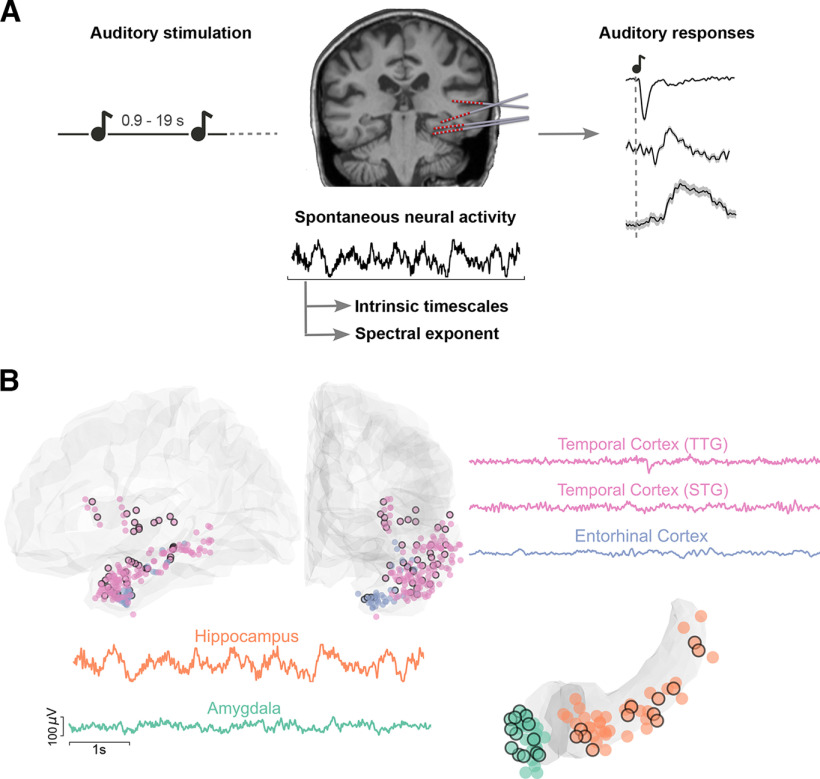
Figure 1.
Experimental paradigm, electrode coverage, and exemplar iEEG traces. A, Summary of the main analyses and methodology. Left, Schematic of the auditory stimulation protocol. Patients were presented with 100 ms pure tones, occurring at random intervals between 0.9 and 19 s. Middle, Example of implanted iEEG electrodes and exemplar raw trace of spontaneous neural activity from one electrode, before sound presentation, which is used to estimate intrinsic timescales and spectral exponents. Right, iERPs are extracted in response to the sounds. These are displayed for a schematic illustration of our protocol, for three exemplar electrodes, presented in more detail in Figure 4. B, Illustration of recorded electrodes (N = 270) over the group of 11 patients. Black-circled electrodes are responsive to the auditory stimulation. As exemplar signals, we show iEEG traces from the transverse and superior temporal gyri (TTG and STG, pink), the entorhinal cortex (light blue), the hippocampus (orange), and the amygdala (green). Each of these regions exhibits characteristic and distinct spontaneous dynamics, displayed here over a 6 s segment.

