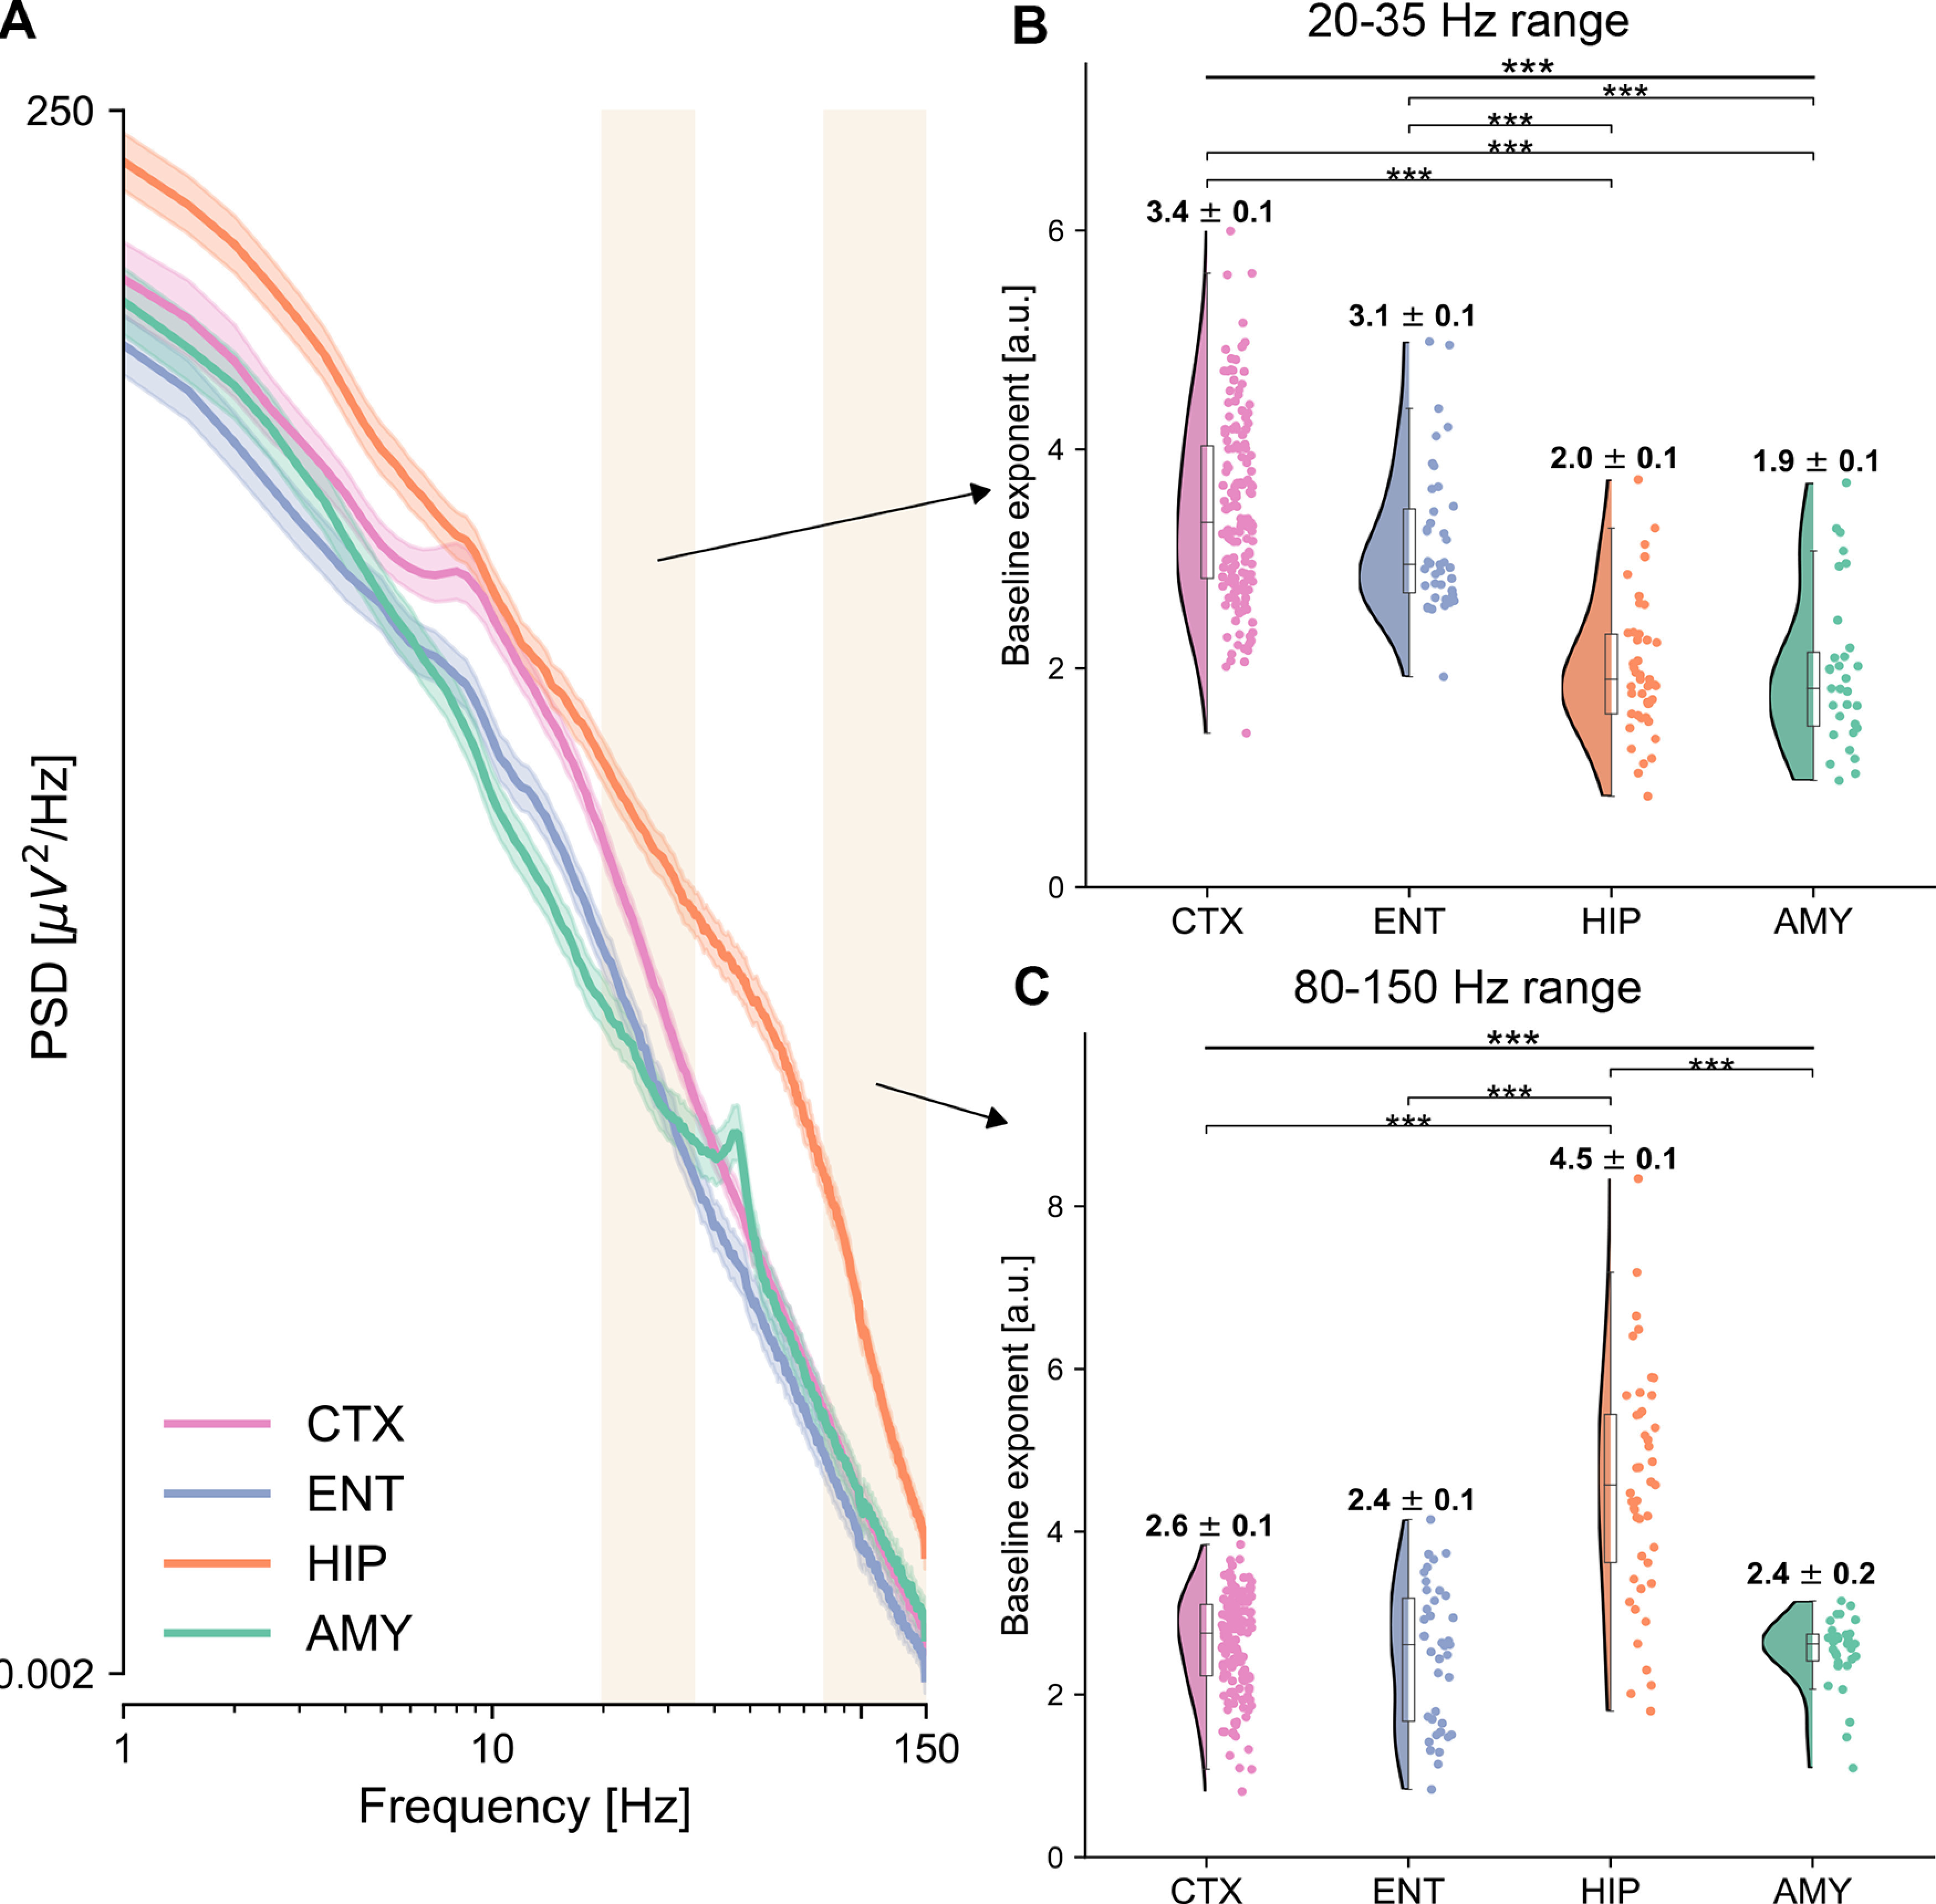
Figure 5.

Power spectra and spectral exponents across brain regions. A, Average power spectra are displayed for the four ROIs. Cortex (pink) exhibits a characteristic oscillatory peak at ∼10 Hz, and a relatively fast decay, while the hippocampus (orange) displays the strongest power, which for low frequencies decay relatively gently, but after 70 Hz much faster. Shaded rectangles represent the two frequency ranges for which the spectral exponent is computed, at 20-35 Hz, and at 80-150 Hz. x and y axes are plotted in logarithmic scales. B, C, Spectral exponent at 20-35 Hz (B) and 80-150 Hz (C), for each electrode and ROI. The spectral exponent in the 20-35 Hz range shows a significant main effect of region, with the temporal cortex having the steepest exponent followed by the entorhinal cortex, the hippocampus, and amygdala, which have flatter exponents. The spectral exponent at 80-150 Hz also shows a significant effect of region, with the hippocampus having the steepest exponent among all other regions, compatible with the knee observed in the average power spectra (A).
