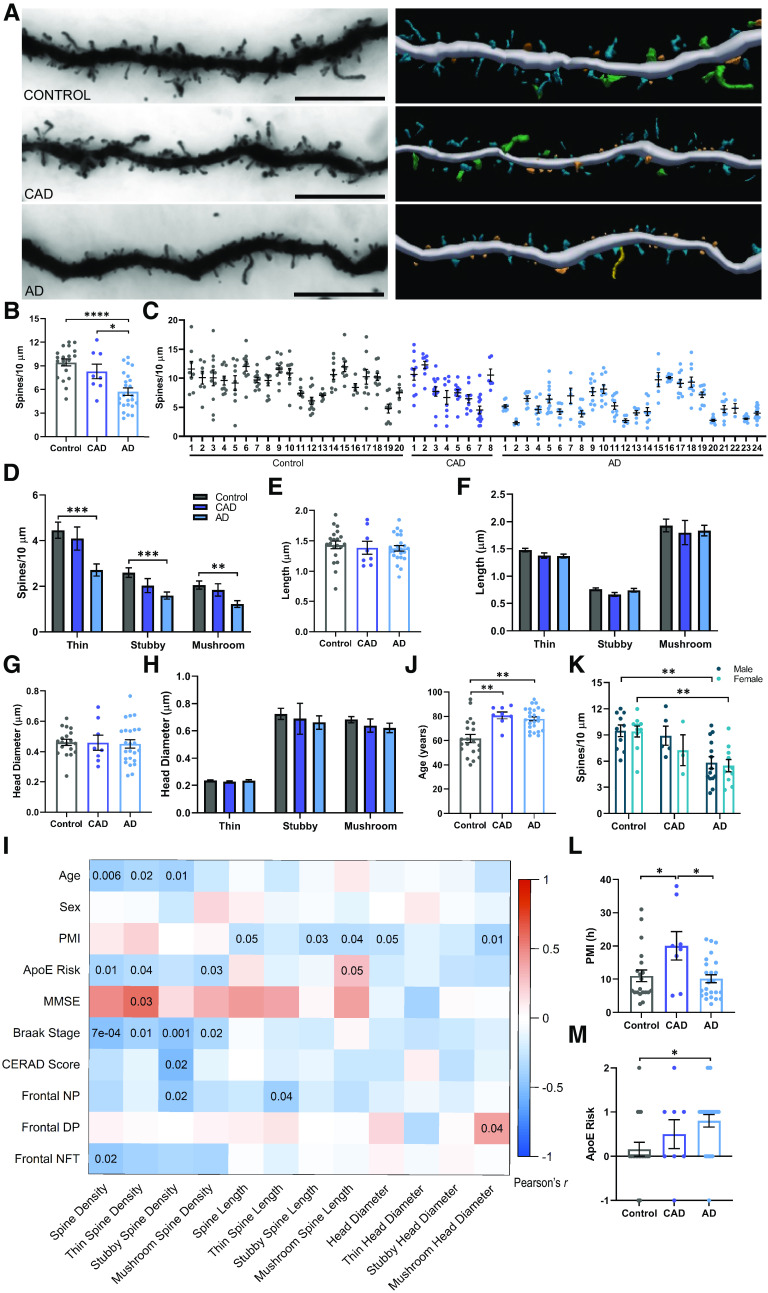
Figure 6.
Entorhinal cortex spine density is reduced in AD. A, Representative brightfield images (left) and three-dimensional reconstructions (right) of Golgi-stained dendrites from control (top), CAD (middle), and AD (bottom) cases. Scale bar = 10 µm. In the reconstructions, blue = thin, orange = stubby, green = mushroom, and yellow = filopodia. B, Dendritic spine density is reduced in AD, but maintained in CAD cases. One-way ANOVA (F(2,49) = 15.36, p < 7.0 × 10⁻⁶) followed by Tukey's multiple comparisons test. *p = 0.019, ****p = 5.0 × 10⁻⁶. C, Dendritic spine density per dendrite for each case. Case numbering corresponds to Tables 1 and 2. Each point represents one dendrite. N = 3–17 dendrites per case. D, Thin, stubby, and mushroom spine densities are reduced in AD compared with controls. One-way ANOVA (Thin: F(2,49) = 8.422, p = 0.0007; Stubby: F(2,49) = 7.680, p = 0.0013; Mushroom: F(2,49) = 7.115, p = 0.0019) with Tukey's multiple comparisons test. Thin ***p = 0.0007, Stubby ***p = 0.0008, Mushroom **p = 0.0017. E, No differences in dendritic spine length were observed between groups. F, Dendritic spine length of thin, stubby, and mushroom spines did not differ between groups. G, No differences in dendritic spine head diameter were observed between groups. H, Head diameter on thin, stubby, and mushroom spines was similar between groups. I, Pearson correlations between dendritic spine measurements and case demographic and pathology data. Uncorrected p-values are shown for correlations with p < 0.05. PMI = postmortem interval, MMSE = Mini-Mental State Examination, NP = neuritic plaques, DP = diffuse plaques, NFT = neurofibrillary tangles. J, CAD and AD cases were significantly older than controls. Kruskal–Wallis test (H(2) = 16.18, p = 0.0003) with Dunn's multiple comparisons test. Control versus CAD **p = 0.004, Control versus AD **p = 0.0014. K, There were no sex differences in dendritic spine density – males and females exhibited a similar reduction in dendritic spine density in the EC in AD. Two-way ANOVA (main effect of diagnosis: F(2,46) = 14.56, p = 1.3 × 10⁻⁵) with Šídák's multiple comparisons test. Male **p = 0.0062, Female **p = 0.0071. L, The PMI before brain collection was longer for CAD cases compared with controls and AD cases. One-way ANOVA (F(2,49) = 4.913, p = 0.0114) with Tukey's multiple comparisons test. CAD versus Control *p = 0.024, versus AD *p = 0.01. M, ApoE risk is higher in AD cases, compared with controls. Calculation of ApoE risk is described in Materials and Methods. One-way ANOVA (F(2,49) = 4.114, p = 0.0223) with Tukey's multiple comparisons test. *p = 0.017. N = 20 Control, 8 CAD, and 24 AD cases. N = 52 (20 control, 8 CAD, and 24 AD), unless specified otherwise. Each point represents one case. Error bars indicate SEM.

