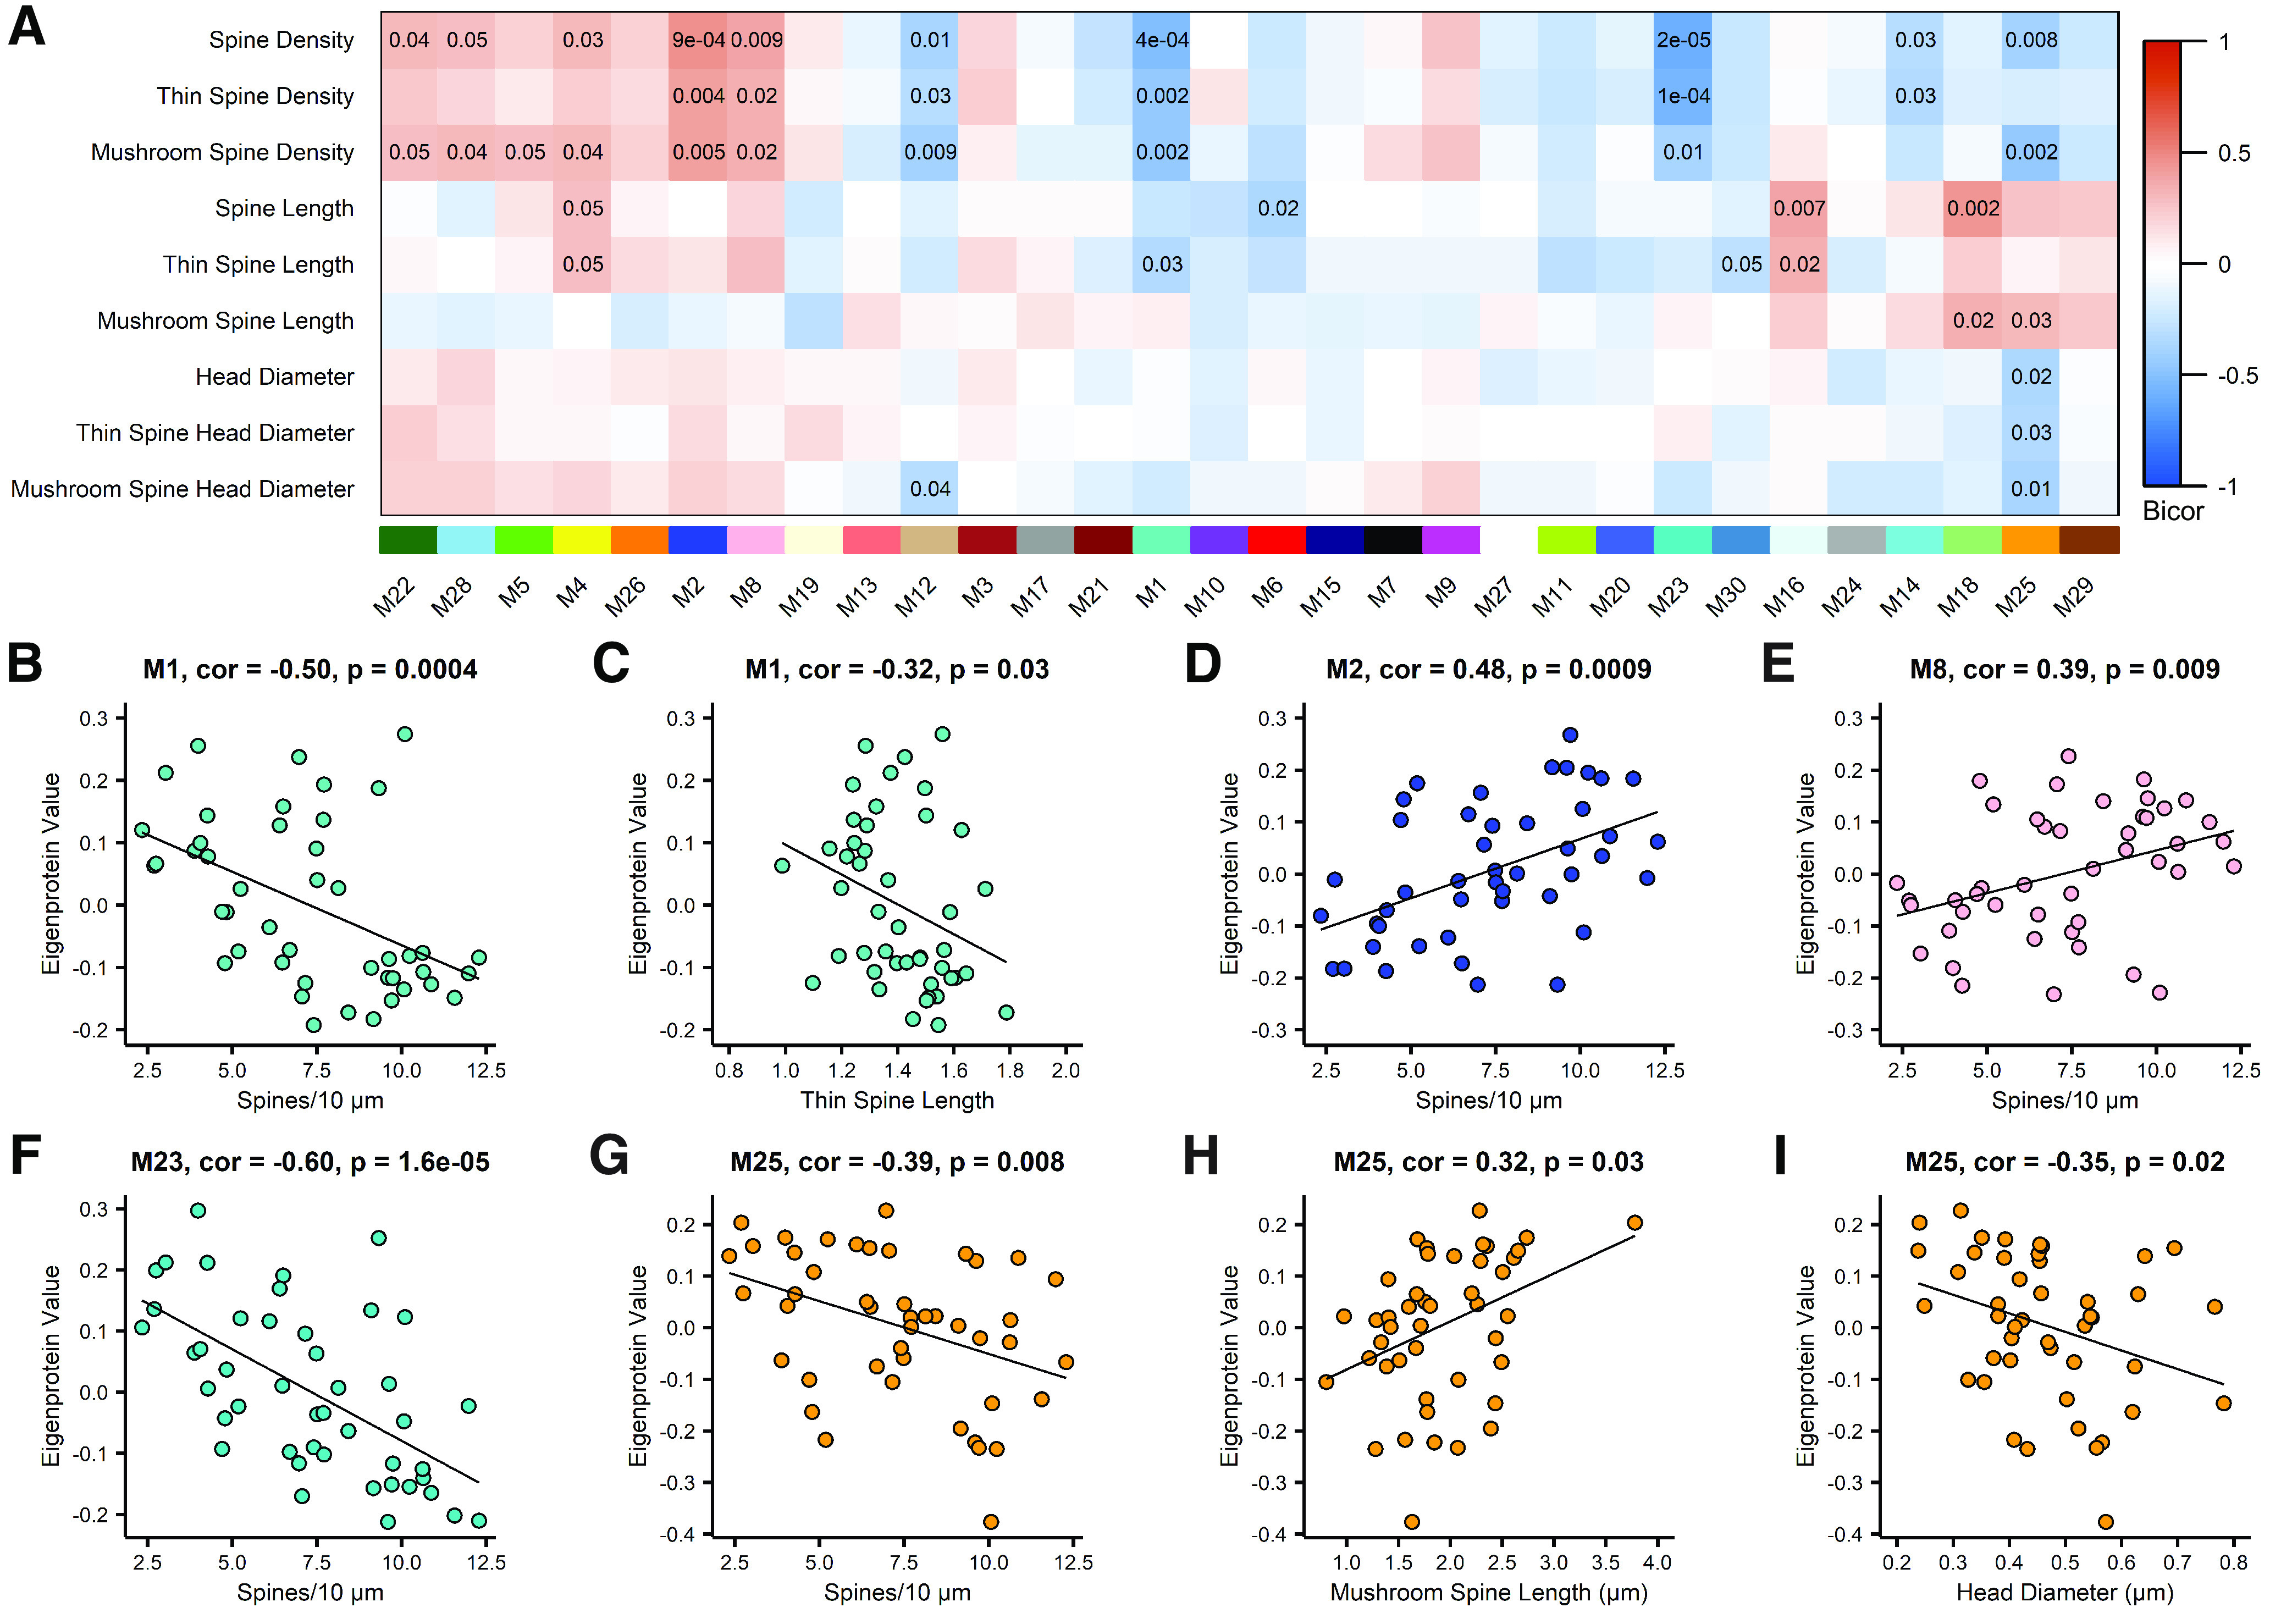
Figure 7.

Protein co-expression modules correlate with dendritic spine density and morphology. A, Biweight midcorrelations (bicor) between module eigenprotein expression and dendritic spine measurements. Uncorrected p-values are shown for correlations with p < 0.05. B, There is a significant inverse correlation between Module 1 eigenprotein abundance and spine density. C, Module 1 eigenprotein abundance is significantly inversely correlated with thin spine length. D, Eigenprotein expression of Module 2 is significantly positively correlated with spine density. E, Module 8 eigenprotein abundance exhibits a significant positive correlation with spine density. F, Module 23 eigenprotein abundance exhibits a significant inverse correlation with spine density. G, Module 25 is significantly inversely correlated with spine density. H, Eigenprotein expression of Module 25 is positively correlated with mushroom spine length. I, There is a significant inverse correlation between Module 25 eigenprotein expression and dendritic spine head diameter. Correlations were assessed by bicor. Each point represents one case. N = 45 (17 Control, 6 CAD, 22 AD).
