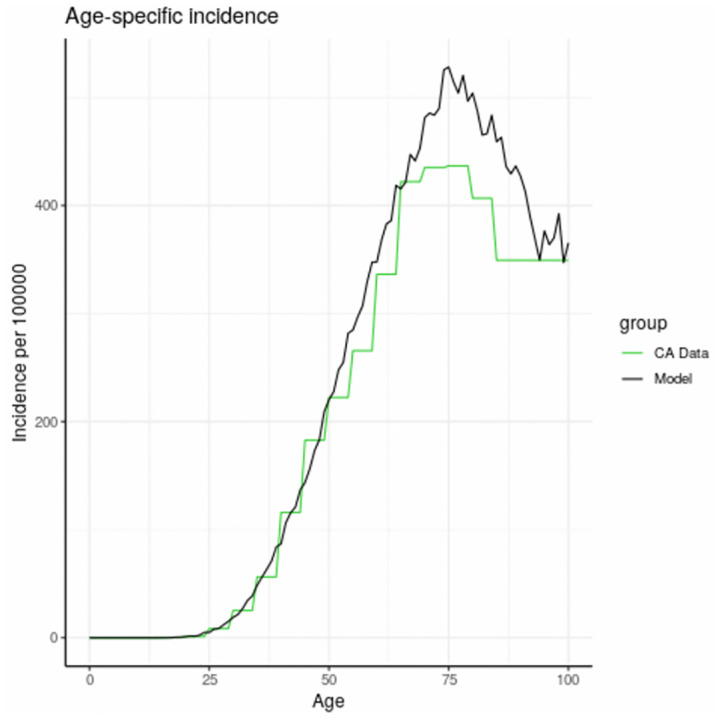
Fig 3. Age specific incidence of breast cancer in California (2008–2012) and in model population.

The flat line at high ages (green curve) is due to the lack of specific age category information for ages 80 and above.

The flat line at high ages (green curve) is due to the lack of specific age category information for ages 80 and above.