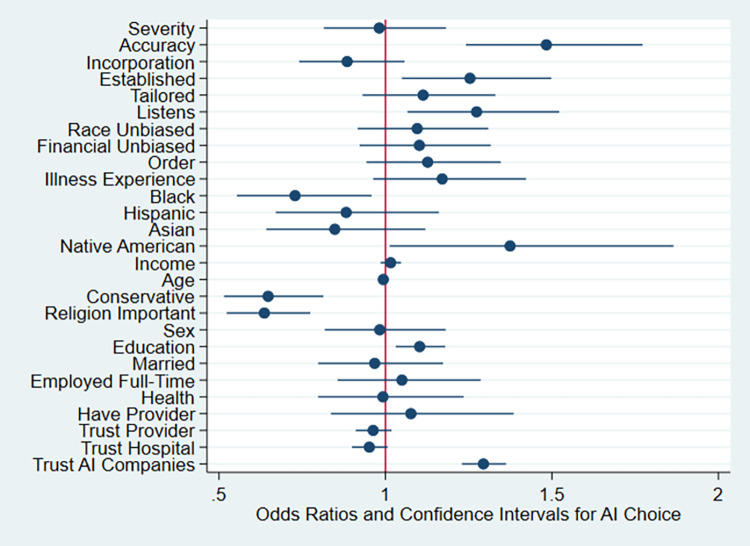
Fig 2. Odds of Selecting an AI Provider by Experimental Condition, Demographics, and Attitudinal Variables, With 95% Confidence Intervals (N = 2198).
Notes: Analysis excludes respondents that failed an attention check requiring recall of the disease presented in the vignette, and those reporting that they did not understand the vignette (bottom two levels on 10-point scale). See Table 3, Model 3 for details.

